Your A1c Can Be Normal While Your Glucose Metabolism Isn’t
Introduction
A normal hemoglobin A1c can be reassuring, but it does not necessarily mean glucose regulation is completely healthy. A1c estimates average glucose exposure over approximately two to three months. It cannot show how high glucose rises after individual meals, how quickly it returns toward baseline or how much insulin the pancreas must produce to keep that average within the normal range.
Fasting glucose has a similar limitation. It captures one moment after several hours without food, often when the liver and pancreas have had time to restore glucose to an acceptable level. Someone in an early insulin-resistant state may therefore have normal fasting glucose and A1c because the pancreas is compensating by releasing more insulin. The glucose result appears normal, but maintaining it has become metabolically more demanding.
A study published in Diabetes Care on September 17, 2026, adds another layer to this discussion. Researchers analyzed 1,356 participants from the Framingham Heart Study who had neither diabetes nor cardiovascular disease. Participants wore blinded continuous glucose monitors for up to 10 days, allowing investigators to examine mean glucose, glucose variability, time spent at different concentrations and patterns that developed throughout the day.
Higher mean glucose and a greater percentage of time above 140 mg/dL were associated with a higher burden of hypertension and hypercholesterolemia. These findings suggest that people who appear metabolically similar according to conventional diagnostic categories may still have meaningfully different glucose patterns.
However, the study does not prove that brief glucose elevations cause cardiovascular disease. It was cross-sectional, meaning the glucose patterns and cardiometabolic risk factors were assessed during the same general period. It also does not establish 140 mg/dL as a universal threshold separating healthy from pathological glucose responses in people without diabetes.
A continuous glucose monitor measures glucose in the interstitial fluid every few minutes, revealing patterns that cannot be captured by a fasting blood draw. That additional information can be valuable, but it must be interpreted carefully. Meals, exercise, sleep, stress, illness, sensor accuracy and even the timing of glucose peaks can affect the curve.
The more useful question is therefore not whether every glucose spike is harmful. It is whether repeated glucose patterns reveal increasing metabolic strain that fasting glucose or A1c has not yet captured. In this article, we will examine what fasting glucose, A1c, fasting insulin, the oral glucose tolerance test and CGM each measure—and why no single result provides a complete picture of insulin sensitivity.
What A1c Cannot Show
Hemoglobin A1c measures the percentage of hemoglobin in red blood cells that has glucose attached to it. Because red blood cells circulate for approximately three months, A1c provides an estimate of average glucose exposure over that period. According to the National Institute of Diabetes and Digestive and Kidney Diseases, an A1c below 5.7% is considered normal for diagnostic purposes.
That makes A1c useful for identifying sustained hyperglycemia, but averaging inevitably removes detail. Two people can have the same A1c while experiencing very different glucose patterns. One may remain relatively stable throughout the day, while another repeatedly rises after meals and then falls toward baseline. Their average glucose may be similar even though their metabolic responses are not.
A1c also does not reveal how much insulin was required to maintain that average. During the earlier stages of insulin resistance, muscle, liver and adipose tissue become less responsive to insulin. The pancreas may compensate by secreting more of it, allowing glucose to remain within the laboratory reference range. This normoglycemic hyperinsulinemic state can persist before fasting glucose or A1c reaches the prediabetes range.
Glucose variability is another missing dimension. A1c cannot show the height of an individual post-meal rise, how long glucose remains elevated, how quickly it returns toward baseline or whether the same meal produces different responses at different times of day. It also cannot reveal overnight patterns or the effects of sleep, exercise and stress.
The test has biological limitations as well. Anemia, recent blood loss, transfusion, kidney or liver disease, pregnancy, hemoglobin variants and other conditions that alter red blood cell production or lifespan can make A1c less representative of actual glucose exposure. When A1c and directly measured glucose do not agree, the discrepancy should be investigated rather than automatically trusting one result.
A normal A1c therefore answers a specific question: average glucose has not crossed an established diagnostic threshold. It does not prove that insulin sensitivity is normal, that post-meal glucose regulation is optimal or that every part of the glucose curve is healthy.
Key takeaway: A1c is a valuable long-term average, but it cannot display glucose variability, post-meal excursions or the amount of insulin required to keep glucose within the normal range.
What Fasting Glucose Measures
Fasting plasma glucose measures the concentration of glucose in the blood after at least eight hours without caloric intake. It is usually collected in the morning and is one of the standard tests used to diagnose prediabetes and diabetes.
According to the American Diabetes Association, a fasting glucose below 100 mg/dL is considered normal for diagnostic purposes. A result from 100 to 125 mg/dL falls within the prediabetes range, while 126 mg/dL or higher may indicate diabetes when confirmed appropriately.
Fasting glucose is particularly useful for evaluating how well the body regulates glucose when food is not actively being absorbed. During an overnight fast, the liver releases glucose to maintain an adequate supply for the brain and other tissues. Insulin normally restrains this production so that glucose remains within a relatively narrow range.
As hepatic insulin resistance develops, insulin becomes less effective at suppressing glucose production by the liver. Fasting glucose may then begin to rise. However, this often occurs later than insulin resistance in skeletal muscle, where most meal-related glucose disposal takes place.
The pancreas may initially compensate by releasing more insulin during and after meals. That additional insulin can return glucose toward baseline before the fasting sample is collected. A fasting glucose of 90 mg/dL can therefore occur in someone with low insulin levels and good insulin sensitivity—or in someone requiring substantially more insulin to achieve the same glucose concentration.
Fasting glucose is also influenced by factors unrelated to long-term metabolic health. Poor sleep, psychological stress, infection, pain, dehydration, corticosteroid medication and the early-morning rise in cortisol and growth hormone can temporarily increase it. Exercise, prolonged fasting, alcohol intake and differences in laboratory handling may also affect the result.
For these reasons, fasting glucose should be interpreted as one part of a metabolic assessment rather than a direct measurement of insulin sensitivity. Pairing it with fasting insulin can provide information about how much pancreatic effort is required to maintain that fasting glucose level.
Key takeaway: Fasting glucose shows how well glucose is being regulated at one fasting moment. It does not reveal post-meal responses or whether elevated insulin is compensating for early insulin resistance.
Why Fasting Insulin Adds Context
Fasting insulin measures how much insulin the pancreas is releasing after several hours without food. When interpreted alongside fasting glucose, it can help distinguish between glucose that is normal because the body is insulin sensitive and glucose that is being held within range through increased insulin secretion.
Consider two people with a fasting glucose of 92 mg/dL. One may require only a small amount of insulin to maintain that concentration. The other may require several times more insulin because the liver, muscle and adipose tissue have become less responsive. Their fasting glucose results look identical, but the physiological effort behind those results is very different.
This compensatory increase in insulin can precede abnormal glucose by years. As insulin resistance develops, pancreatic beta cells release more insulin to overcome the reduced response of target tissues. Glucose may remain normal during this phase because compensation is still working. Hyperglycemia becomes more likely when insulin resistance progresses, beta-cell function declines or the pancreas can no longer produce enough insulin to meet demand.
Fasting insulin is not, however, a standardized diagnostic test for insulin resistance. The National Institute of Diabetes and Digestive and Kidney Diseases notes that direct testing for insulin resistance is used primarily in research, while clinical diagnosis generally relies on glucose-based testing and the broader metabolic picture.
One difficulty is that insulin assays vary among laboratories. Reference ranges can be broad, and there is no universally accepted fasting-insulin threshold that diagnoses insulin resistance in every population. Insulin secretion is also affected by recent food intake, carbohydrate exposure, physical activity, sleep, stress, medications and the duration of the fast.
A low fasting insulin is not automatically favorable either. In someone with elevated glucose, it may indicate that the pancreas is failing to produce enough insulin rather than excellent insulin sensitivity. This is why glucose and insulin must be interpreted together. C-peptide may provide additional information when pancreatic insulin production is uncertain or when someone uses injected insulin.
Fasting glucose and fasting insulin can also be combined to calculate HOMA-IR, an estimate of insulin resistance. Although HOMA-IR has limitations and is not a definitive diagnostic test, it can make the relationship between glucose and insulin more visible than either measurement alone.
Key takeaway: Fasting insulin helps reveal the metabolic effort required to maintain fasting glucose. A normal glucose result becomes more informative when we also know how much insulin was needed to produce it.
What HOMA-IR Adds
HOMA-IR, or the Homeostatic Model Assessment of Insulin Resistance, combines fasting glucose and fasting insulin into a single estimate. It was developed to describe the feedback relationship between glucose production by the liver and insulin secretion by pancreatic beta cells during the fasting state.
When glucose is reported in milligrams per deciliter, the commonly used calculation is:
If glucose is reported in millimoles per liter, the calculation is:
For example, a fasting glucose of 90 mg/dL and fasting insulin of 12 µIU/mL would produce:
The value becomes higher when fasting glucose, fasting insulin or both are elevated. This can reveal a difference that glucose alone misses. A person with a fasting glucose of 90 mg/dL and insulin of 4 µIU/mL will have a much lower HOMA-IR than someone with the same glucose and an insulin of 16 µIU/mL.
The original HOMA model was introduced in 1985 and showed a meaningful correlation with the euglycemic clamp, a more intensive research method for evaluating insulin sensitivity. However, the original investigators also reported considerable variability in the estimate.
There is no universal HOMA-IR cutoff that diagnoses insulin resistance in every person. Proposed thresholds vary with age, sex, ethnicity, population, laboratory method and metabolic condition. A result should therefore be interpreted relative to the laboratory method, clinical context and changes over time rather than treated as an absolute pass-or-fail score.
HOMA-IR also primarily reflects fasting glucose-insulin regulation and is influenced strongly by hepatic insulin resistance. It may not capture early skeletal-muscle insulin resistance that becomes most visible after a carbohydrate-containing meal or glucose challenge.
The calculation becomes less reliable when someone uses injected insulin, has significant beta-cell failure, is acutely ill, is taking medications that substantially alter glucose or insulin, or was not properly fasted. HOMA2, a newer computer-based model, accounts for more of the nonlinear relationship between glucose and insulin but still remains an estimate rather than a direct measurement.
Key takeaway: HOMA-IR makes the relationship between fasting glucose and insulin easier to see, but it is an estimate of fasting physiology—not a universal diagnostic test or a complete measurement of metabolic health.
What the OGTT Reveals
The oral glucose tolerance test, or OGTT, moves beyond fasting physiology by observing how the body responds to a standardized glucose challenge. After an overnight fast, a baseline blood sample is collected. The person then drinks a solution containing 75 grams of glucose, and additional samples are collected over the following two hours.
For diagnosing prediabetes and diabetes in nonpregnant adults, the conventional interpretation focuses on the two-hour glucose result. A value below 140 mg/dL is considered normal, 140 to 199 mg/dL indicates impaired glucose tolerance, and 200 mg/dL or higher may indicate diabetes when appropriately confirmed.
The two-hour result is useful, but it does not describe the complete response. Glucose may rise rapidly during the first hour and return below 140 mg/dL by the two-hour measurement. If only the fasting and two-hour samples are collected, the height and timing of that earlier excursion remain unknown.
Measuring insulin at the same intervals can reveal even more. Someone may maintain glucose within conventional limits only by producing an unusually large or prolonged insulin response. Another person may have an inadequate early insulin release, producing a higher initial glucose peak even if the two-hour result later appears acceptable.
A more detailed glucose-and-insulin tolerance test may collect samples at baseline and at 30, 60, 90 and 120 minutes. This can show how quickly insulin is released, how high glucose rises, whether insulin remains elevated and how efficiently glucose returns toward baseline. It can therefore detect metabolic patterns that fasting glucose and A1c may not reveal.
The OGTT still has limitations. Drinking pure glucose is not equivalent to eating a mixed meal containing protein, fat and fiber. Results may also be affected by recent carbohydrate intake, physical activity, illness, sleep, medications and whether the person remained inactive during the test. Reproducibility is imperfect, so one borderline result should be interpreted cautiously.
Unlike CGM, the OGTT provides a standardized challenge under controlled conditions. Unlike a conventional OGTT, CGM shows how glucose behaves during ordinary meals, sleep, stress and physical activity. The two approaches answer related but different questions.
Key takeaway: An OGTT tests the body’s ability to manage a defined glucose load. Adding insulin measurements and intermediate time points can reveal excessive compensation or delayed glucose clearance that a fasting test or two-hour value alone may miss.
What CGM Adds
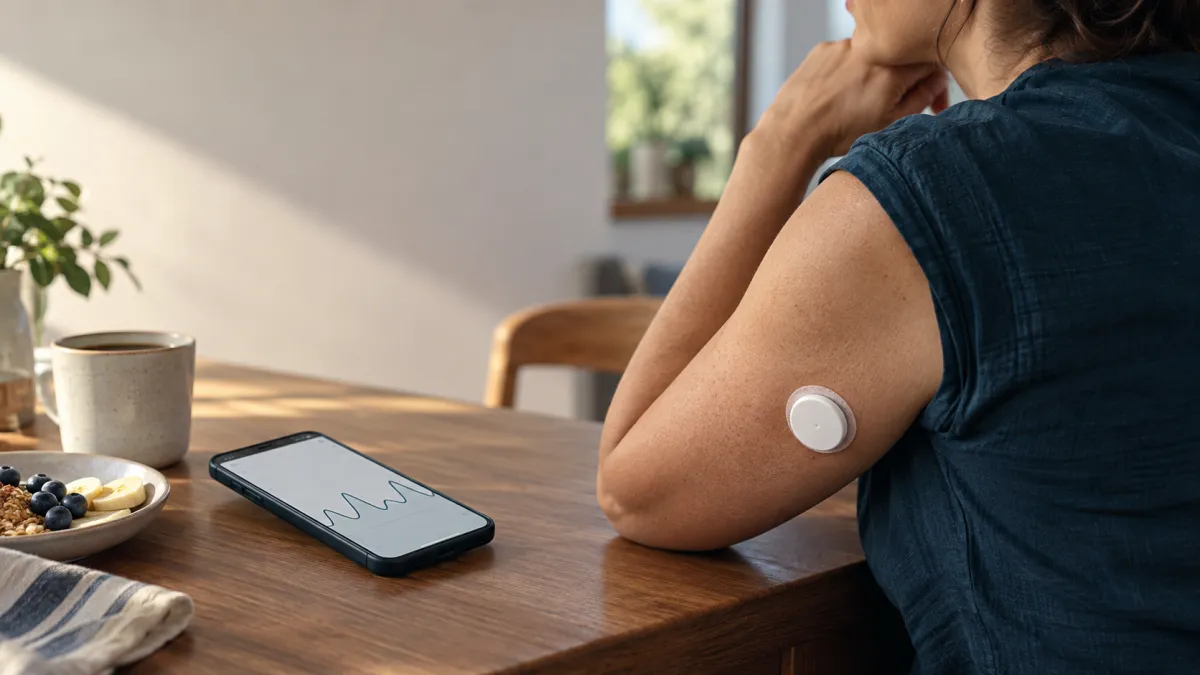
A continuous glucose monitor changes the type of information available. Instead of measuring glucose at one moment or estimating an average over several months, CGM records interstitial glucose every few minutes. The result is a continuous curve showing when glucose rises, how high it reaches, how long it remains elevated and how quickly it returns toward baseline.
Several measurements can be derived from that curve. Mean glucose describes overall exposure. Time above a selected threshold estimates how much of the day is spent at higher concentrations. Glucose variability measures how widely values fluctuate, while post-meal patterns show the height, duration and timing of individual excursions.
These measurements can separate people who appear similar on conventional testing. Two individuals may share an A1c of 5.4%, for example, while one maintains a relatively narrow glucose range and the other experiences repeated meal-related elevations followed by rapid declines. The average alone cannot show that difference.
The new Framingham Heart Study analysis demonstrates why this distinction may matter. Among 1,356 participants without diabetes or cardiovascular disease, higher mean CGM glucose and a greater percentage of time above 140 mg/dL were associated with a greater burden of hypertension and hypercholesterolemia. The researchers also identified differences in variability and temporal glucose patterns across cardiometabolic profiles.
That does not make 140 mg/dL a universal boundary between harmless and harmful glucose. Healthy people can temporarily exceed that concentration after eating, and the significance of an excursion depends on its magnitude, duration, frequency and context. A brief rise followed by efficient clearance is physiologically different from repeated elevations that remain high for several hours.
CGM also cannot measure insulin. A flat glucose curve could reflect good insulin sensitivity, a low-carbohydrate meal or a large compensatory insulin response. Conversely, a higher glucose rise may occur after carbohydrate intake even in someone who remains metabolically healthy. Pairing CGM patterns with fasting insulin, HOMA-IR or a glucose-and-insulin tolerance test can help distinguish these possibilities.
Sensor limitations must also be considered. CGMs measure glucose in interstitial fluid rather than directly in blood, creating a short delay when glucose is changing rapidly. Pressure on the sensor during sleep can produce falsely low readings, and individual sensors may read consistently higher or lower than laboratory glucose. Isolated values should therefore receive less attention than reproducible patterns.
The greatest value of CGM in someone without diabetes may be its ability to generate better questions. Which meals repeatedly produce prolonged elevations? Does walking after eating change the response? Are morning values higher after poor sleep? Does the same food produce a different curve depending on exercise, meal timing or the order in which foods are eaten?
Key takeaway: CGM exposes glucose dynamics that fasting glucose and A1c cannot show, but it does not directly measure insulin resistance or establish that every excursion above 140 mg/dL is pathological. Patterns and context matter more than a single peak.
What Counts as a Glucose Spike?
The term “glucose spike” is used constantly online, but it does not have a universally accepted clinical definition for people without diabetes. A rise above 120, 140 or even 180 mg/dL may be labeled a spike depending on the source, yet these numbers do not carry the same meaning in every situation.
The frequently used 140 mg/dL threshold partly comes from oral glucose tolerance testing, where a two-hour glucose below 140 mg/dL is considered normal. That does not mean glucose must remain below 140 mg/dL every minute of the day. A transient post-meal peak and a glucose concentration that remains elevated two hours after a standardized challenge represent different physiological events.
Research can tell us what is common without yet establishing what is harmful. In a 2026 Diabetes Care study of 8,687 adults without diabetes, participants spent a median of approximately 98% of their monitored time below 140 mg/dL. Less time below that threshold was associated with greater visceral fat, higher triglycerides, higher blood pressure, elevated ALT and a greater subsequent risk of metabolic disease. However, the study was observational and cannot prove that reducing every excursion above 140 mg/dL will prevent those outcomes. Read the study
A glucose response is better evaluated through several characteristics rather than one peak number. The starting glucose matters because a rise from 75 to 135 mg/dL differs from a rise from 115 to 175 mg/dL. Duration matters because returning toward baseline within a reasonable period suggests more efficient clearance than remaining elevated for several hours. Frequency also matters: an occasional excursion after an unusual meal is different from a similar response after every meal.
Recovery can be as informative as the peak. Glucose that rises quickly and then falls below its starting point may reflect a large insulin response. A curve that appears “good” because glucose returns rapidly is not necessarily evidence of excellent insulin sensitivity if excessive insulin was required to produce that decline.
Meal composition and context must also be considered. The same person may respond differently depending on carbohydrate quantity, food processing, sleep, stress, exercise, meal timing and whether carbohydrate was eaten alone or with other foods. A single response should not be used to permanently classify a food—or the person consuming it—as healthy or unhealthy.
Current standards remain cautious. The 2026 American Diabetes Association Standards of Care state that evidence remains insufficient to use CGM for screening or diagnosing prediabetes or diabetes. Diagnostic decisions still require validated laboratory testing.
For someone without diabetes, a potentially concerning pattern is not simply crossing 140 mg/dL once. More attention may be warranted when elevations are frequent, prolonged, progressively worsening or accompanied by higher fasting insulin, abnormal HOMA-IR, elevated triglycerides, low HDL cholesterol, fatty liver, increasing waist circumference or other signs of metabolic dysfunction.
Key takeaway: There is no validated universal CGM threshold for a pathological glucose spike in people without diabetes. Peak height matters, but duration, recovery, frequency, starting glucose and the surrounding metabolic context matter more.
How the Results Fit Together
Each glucose-related test examines a different part of the same regulatory system. The most useful interpretation comes from identifying whether the results tell a consistent story—or whether one measurement reveals metabolic stress that the others have not yet captured.
Normal fasting glucose, normal A1c and relatively low fasting insulin generally suggest that glucose is being maintained without excessive pancreatic compensation. If an OGTT also shows efficient glucose clearance and CGM demonstrates limited variability, the findings become more reassuring because fasting, long-term and post-meal physiology all point in the same direction.
A different pattern emerges when fasting glucose and A1c remain normal but fasting insulin and HOMA-IR are elevated. In this situation, glucose regulation appears normal because the pancreas is producing more insulin to overcome resistance in muscle, liver or adipose tissue. This may represent an earlier compensated phase before conventional glucose thresholds become abnormal.
CGM may or may not look abnormal during that phase. A relatively flat curve does not exclude insulin resistance if high insulin is maintaining it. Conversely, frequent or prolonged post-meal elevations can suggest that compensation is becoming less effective, particularly when they appear alongside rising fasting insulin, triglycerides, waist circumference or liver fat.
Another pattern is normal fasting glucose with an abnormal OGTT or repeated meal-related CGM excursions. This can occur when fasting hepatic glucose regulation remains adequate but skeletal muscle does not dispose of meal-derived glucose efficiently. Since muscle is responsible for much of post-meal glucose uptake, impaired muscle insulin sensitivity may become visible during a challenge before fasting glucose rises.
Elevated glucose accompanied by insulin that is low or unexpectedly normal requires a different interpretation. Rather than indicating good insulin sensitivity, it may suggest inadequate pancreatic insulin production. C-peptide, diabetes-associated autoantibodies and clinical history may be needed to evaluate beta-cell function and distinguish insulin-resistant type 2 diabetes from insulin-deficient forms of diabetes.
Results should also be interpreted alongside triglycerides, HDL cholesterol, blood pressure, waist circumference, liver enzymes and evidence of fatty liver. These markers can reveal the broader metabolic environment in which the glucose pattern is occurring. A technically normal A1c becomes less reassuring when it accompanies hyperinsulinemia, high triglycerides, low HDL and increasing abdominal adiposity.
CGM contributes real-world context but should not replace laboratory testing. As discussed in QLM’s guide to continuous glucose monitoring without diabetes, the objective is not simply to collect more glucose data. It is to understand what the pattern means alongside insulin, lipids, liver health and other cardiometabolic markers.
Key takeaway: Fasting glucose, A1c, fasting insulin, HOMA-IR, OGTT and CGM are not competing tests. Each answers a different physiological question, and their greatest value comes from interpreting them together.
Who May Benefit From CGM?
CGM is not necessary for every person with a normal A1c. Its greatest value occurs when there is a specific question that static laboratory testing has not answered or when real-time feedback could help evaluate a targeted lifestyle change.
Someone with a family history of type 2 diabetes, previous gestational diabetes, polycystic ovary syndrome, fatty liver, abdominal obesity, elevated triglycerides or other signs of insulin resistance may benefit from seeing how glucose behaves outside the fasting state. CGM may be particularly informative when fasting glucose and A1c appear normal but fasting insulin, HOMA-IR or other cardiometabolic markers suggest compensation.
It may also help when laboratory results do not agree. A person could have a normal A1c but borderline fasting glucose, an elevated one-hour glucose during an OGTT or symptoms that appear after certain meals. A short period of CGM can show whether these findings represent isolated events or a reproducible daily pattern.
Another useful application is structured experimentation. A person can compare the same meal under different conditions, such as before and after a walk, earlier versus later in the day or following adequate versus poor sleep. This turns CGM into a tool for testing a specific hypothesis rather than an endless search for a perfectly flat line.
Over-the-counter access has made this easier. The FDA has cleared CGM systems for adults who do not use insulin, including people without diabetes who want to understand how diet and exercise affect glucose. However, the FDA’s clearance does not mean these devices can diagnose insulin resistance, prediabetes or diabetes.
CGM may be less appropriate for people who are likely to become anxious or excessively restrictive in response to normal fluctuations. Constantly checking glucose can encourage avoidance of nutritious foods simply because they produce a temporary rise. For someone with an active or previous eating disorder, CGM should be considered carefully and used only with appropriate clinical support.
Consumer systems intended for people who do not use insulin may also be inappropriate when there is a significant risk of hypoglycemia. Anyone using insulin or glucose-lowering medication should interpret CGM data with the prescribing clinician rather than making independent medication changes.
The most productive use is often time-limited and question-driven. The objective is to identify repeatable patterns, compare them with laboratory markers and decide whether any finding requires formal evaluation. It is not to eliminate every post-meal rise or keep glucose perfectly flat throughout the day.
Key takeaway: CGM may be useful when metabolic risk is present, laboratory results are discordant or a specific lifestyle question needs to be tested. It becomes less useful when normal variation creates anxiety or data are collected without a clear plan for interpretation.
Conclusion
A normal A1c is valuable information, but it is not a complete metabolic assessment. It shows that average glucose has not crossed an established diagnostic threshold. It does not reveal post-meal excursions, glucose variability or how much insulin the pancreas must produce to maintain that average.
The new Framingham Heart Study findings support the idea that meaningful differences exist among people who do not have diabetes. Higher mean CGM glucose and more time above 140 mg/dL were associated with hypertension and hypercholesterolemia, suggesting that glucose patterns may reflect broader cardiometabolic differences before conventional diagnostic thresholds are reached.
These findings should not be interpreted as proof that every rise above 140 mg/dL is harmful. The study was cross-sectional, CGM has not been validated as a diagnostic test for insulin resistance, and no universal glucose-spike threshold exists for people without diabetes.
The most useful approach is to combine measurements. Fasting glucose provides a snapshot. A1c estimates longer-term exposure. Fasting insulin and HOMA-IR provide information about pancreatic compensation. An OGTT evaluates the response to a standardized challenge, while CGM reveals patterns during ordinary meals, sleep, exercise and stress.
When these results are interpreted together, metabolic dysfunction may become visible before chronic hyperglycemia develops. That creates an opportunity to investigate rising insulin demand, impaired glucose clearance, fatty liver, abnormal lipids, loss of muscle mass and other contributing factors while glucose regulation is still largely preserved.
QuickLab Mobile provides convenient at-home blood collection in Miami for fasting glucose, A1c, fasting insulin, C-peptide, lipid testing, ApoB, liver-related markers and other cardiometabolic tests that can help place CGM data in context. Results should be interpreted with a qualified healthcare professional rather than used to self-diagnose insulin resistance or diabetes.
👉 Need a specimen collection?. Book Now
Disclaimer:
The information provided in this blog, podcast, and associated content is for educational and informational purposes only and is not intended as a substitute for professional medical advice, diagnosis, or treatment. The content shared is based on reputable sources, medical literature, and expert insights, but it should not be used as a replacement for direct consultation with a licensed healthcare provider.
No Doctor-Patient Relationship: Engaging with this content does not create a doctor-patient relationship between you and QuickLabMobile or any contributors. Always consult with a qualified physician, specialist, or healthcare professional before making any medical decisions, changing your treatment plan, or starting/stopping any medications.
Not a Substitute for Medical Advice: While we strive to provide accurate and up-to-date information, medicine is constantly evolving. New research, treatments, and medical recommendations may emerge, and individual health conditions can vary. Do not rely solely on this content for health decisions. If you are experiencing symptoms, have concerns about your health, or require medical assistance, seek immediate care from a licensed medical professional.
Emergency Situations: If you are experiencing a medical emergency, such as difficulty breathing, chest pain, signs of a stroke, or any other life-threatening condition, call 911 (or your local emergency services) immediately. Do not delay seeking emergency care based on information provided here.
Liability Disclaimer: QuickLabMobile, its contributors, and any associated entities do not assume liability for any damages, harm, or adverse outcomes resulting from the use, interpretation, or misuse of the information provided in this content. You are responsible for your own healthcare decisions and should always verify information with a trusted medical professional.
External Links & References: This content may include links to external sources, medical studies, or third-party websites for further reading. These links are provided for convenience and informational purposes only. QuickLabMobile does not endorse, control, or take responsibility for the accuracy of external content. Always verify information with authoritative sources such as the CDC, NIH, WHO.
Final Note: Your health is unique, and what works for one person may not be suitable for another. Stay informed, ask questions, and always prioritize professional medical guidance