Prediabetes, Insulin Resistance, and Beta-Cell Function
Introduction
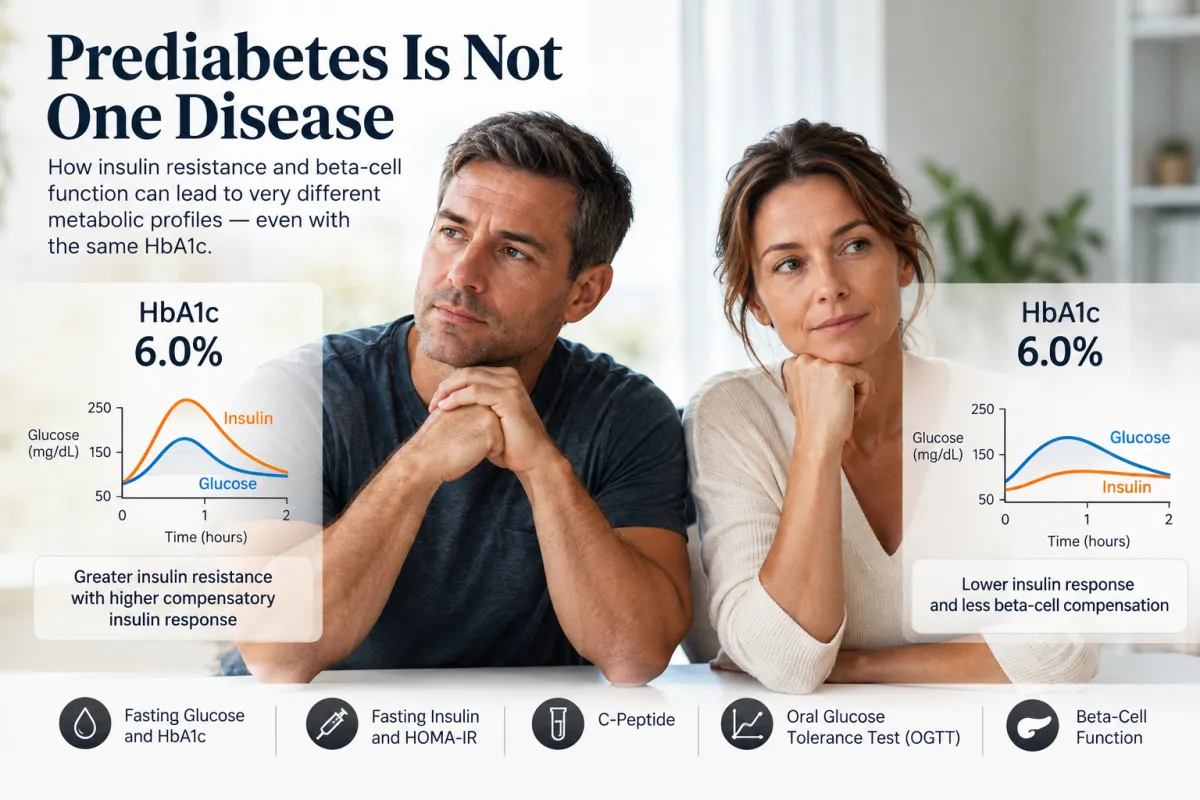
Imagine two people sitting in the same clinic with the same HbA1c of 6.0%. Both meet criteria for prediabetes. On paper, they appear to have essentially the same problem. Metabolically, however, they may be in very different situations.
The first person may be highly insulin resistant. Their muscle, liver, and adipose tissue respond poorly to insulin, but the pancreatic beta cells are still capable of compensating by producing substantially more insulin. Glucose therefore remains only moderately elevated because hyperinsulinemia is helping hold it there. The second person may have less severe insulin resistance but a pancreas that can no longer generate an adequate insulin response for the degree of resistance present. Their HbA1c may be identical, yet their remaining capacity to compensate could be very different.
This distinction matters because prediabetes is a glucose-defined category, not a complete description of the physiology producing that glucose level. Fasting glucose and HbA1c tell us that glycemic regulation has become abnormal, but they cannot independently tell us how insulin resistant someone is, how much insulin the pancreas is producing to compensate, or whether beta-cell function is beginning to deteriorate.
A new prospective study published in Diabetes, Obesity and Metabolism illustrates why that distinction may be important. Researchers studied 645 Chinese adults with prediabetes using an oral glucose tolerance test (OGTT) and calculated ISSI-2, an index designed to evaluate insulin secretion in relation to insulin sensitivity and the glucose stimulus. Among the 410 participants with two-year follow-up data, 136 progressed to diabetes while 61 returned to normoglycemia. Higher ISSI-2 was associated with substantially lower odds of progression and greater odds of returning to normal glycemia, while HOMA-IR showed less consistent associations with those transitions.
The study does not establish ISSI-2 as a routine clinical test, nor does it mean insulin resistance is unimportant. Instead, it reinforces a fundamental feature of type 2 diabetes: the trajectory toward diabetes depends not only on insulin resistance, but also on whether pancreatic beta cells can continue compensating for it.
Understanding prediabetes therefore requires looking beyond the glucose number itself. The better question may not simply be “Does this person have prediabetes?” but “What metabolic process is producing their prediabetes, and how well is the pancreas still compensating?”
🎧 Listen to the Episode: Prediabetes, Insulin Resistance, Beta Cell Function
Two people can both have an HbA1c of 6.0% and yet have very different metabolic problems. One may be compensating for severe insulin resistance with high insulin levels, while the other may already be losing the beta-cell capacity needed to keep glucose controlled.
In this episode of The Health Pulse, we explore insulin sensitivity, beta-cell function, disposition index, ISSI-2, fasting insulin, C-peptide, and the OGTT to explain why prediabetes is better understood as a spectrum of metabolic phenotypes rather than a single disease state.
▶️ Click play below to listen, or keep reading to discover why the same HbA1c can hide very different levels of metabolic risk—and why understanding the difference may matter for prevention and remission.
What Does “Prediabetes” Actually Tell Us?
Prediabetes is primarily a classification of abnormal glucose regulation. According to the 2026 American Diabetes Association Standards of Care, it can be identified by an HbA1c of 5.7–6.4%, fasting plasma glucose of 100–125 mg/dL, or a 2-hour glucose of 140–199 mg/dL during a 75-g oral glucose tolerance test. Importantly, these tests do not always identify the same people. The ADA specifically notes that fasting glucose, HbA1c, and 2-hour OGTT glucose reflect different aspects of glucose metabolism and show incomplete concordance.
That means the label already contains several different metabolic patterns. Someone may predominantly have impaired fasting glucose, another person may have relatively normal fasting glucose but impaired glucose tolerance after a glucose challenge, and another may enter the category primarily because of an elevated HbA1c. Even within the same diagnostic category, risk exists on a continuum: an HbA1c of 5.7% and an HbA1c of 6.4% technically carry the same label, but they should not be interpreted as metabolically identical. The ADA similarly emphasizes that the risk of progression rises continuously rather than suddenly appearing at a particular cutoff.
More importantly, these glucose measurements show us the result of metabolic dysfunction rather than its entire mechanism. Blood glucose at any moment reflects a balance among glucose entering the circulation, glucose production by the liver, glucose uptake by tissues such as skeletal muscle, and the pancreatic insulin response coordinating those processes. HbA1c then provides an integrated estimate of glycemic exposure over the preceding months. Neither measurement directly tells us how much insulin was required to maintain that glucose level or how much compensatory capacity remains in the beta cells.
This distinction becomes critical during the development of type 2 diabetes. Insulin resistance can exist for years while glucose remains relatively normal because pancreatic beta cells increase insulin secretion to compensate. Hyperglycemia becomes progressively more likely when that compensation is no longer sufficient for the degree of insulin resistance present. Prediabetes therefore should not be viewed simply as “mild diabetes.” It can represent different combinations of insulin resistance, compensatory hyperinsulinemia, impaired glucose tolerance, hepatic glucose dysregulation, and declining beta-cell function.
That brings us to the central question raised by the new study: if two people have similar glucose levels today, could the ability of their beta cells to compensate help tell us something about where their glucose is heading tomorrow?
Insulin Resistance Is Only Half of the Equation
Insulin resistance means that tissues such as skeletal muscle, liver, and adipose tissue require a greater insulin signal to produce the same metabolic response. In skeletal muscle, this can mean less efficient insulin-stimulated glucose uptake; in the liver, insulin may become less effective at suppressing hepatic glucose production; and in adipose tissue, impaired insulin action can contribute to greater release of fatty acids. Yet insulin resistance by itself does not guarantee that blood glucose will immediately rise into the prediabetes or diabetes range.
The reason is beta-cell compensation. When insulin sensitivity falls, pancreatic beta cells can respond by increasing insulin secretion. An insulin-sensitive person may require relatively little insulin to maintain normal glucose, while someone who is substantially insulin resistant may require several times more. As long as the pancreas can appropriately increase insulin output, glucose tolerance can remain relatively normal—sometimes at the cost of chronically elevated insulin levels. This is why hyperinsulinemia can precede overt hyperglycemia during the development of type 2 diabetes.
This relationship is often described as hyperbolic: as insulin sensitivity decreases, insulin secretion must increase to compensate. Researchers therefore evaluate beta-cell function relative to the amount of insulin resistance present rather than interpreting insulin secretion in isolation. The disposition index captures this concept by relating insulin secretion to insulin sensitivity. If insulin sensitivity falls by half, for example, maintaining glucose regulation generally requires a compensatory increase in insulin secretion. If that compensation occurs, glucose tolerance may remain relatively stable. If insulin secretion fails to rise sufficiently, glucose begins to increase.
This also explains why a high insulin concentration is not necessarily evidence of “strong” beta-cell function. An insulin-resistant person may produce large amounts of insulin and still have an inadequate response relative to the metabolic demand being placed on the pancreas. Conversely, an insulin value that falls within a laboratory reference range may not represent adequate secretion if glucose is already elevated. Insulin secretion therefore has to be interpreted in context: How much glucose stimulated the response, and how insulin resistant was the person when that response occurred?
The transition toward type 2 diabetes becomes increasingly likely when beta cells can no longer sustain sufficient compensation. Genetics, chronic nutrient excess, ectopic fat accumulation, hyperglycemia, elevated fatty-acid exposure, oxidative and endoplasmic-reticulum stress, inflammation, and changes in beta-cell identity and function have all been investigated as contributors to this deterioration. The precise contribution of each varies among individuals, but the broader physiological principle is well established: type 2 diabetes develops through the interaction between insulin resistance and inadequate beta-cell compensation—not insulin resistance alone.
This is exactly why measuring beta-cell function without accounting for insulin sensitivity can be misleading—and why the new study's use of ISSI-2 is particularly interesting.
What Is ISSI-2?
ISSI-2, or the Insulin Secretion-Sensitivity Index-2, is an OGTT-derived estimate of beta-cell function that accounts for insulin sensitivity. Rather than asking only how much insulin the pancreas produces, it asks whether that insulin response is appropriate for both the glucose stimulus and the person's degree of insulin resistance. In that sense, ISSI-2 is designed as an oral glucose tolerance test analogue of the disposition index—the physiological relationship discussed in the previous section.
Calculating ISSI-2 requires multiple glucose and insulin measurements during an oral glucose tolerance test (OGTT). The insulin-secretory component is estimated from the ratio of the areas under the insulin and glucose curves, while insulin sensitivity is estimated using the Matsuda index. Conceptually, the calculation can be written as ISSI-2 = (AUC insulin ÷ AUC glucose) × Matsuda insulin sensitivity index. Validation studies have found ISSI-2 to correlate with disposition-index measurements obtained using more intensive physiological methods, making it useful for research involving larger populations.
The key advantage is context. Consider two people who produce similar amounts of insulin during an OGTT. If one is relatively insulin sensitive, that response may be entirely adequate. If the other is severely insulin resistant, the same insulin response may represent insufficient beta-cell compensation. Looking only at insulin concentrations could obscure that difference; ISSI-2 attempts to quantify it by evaluating secretion relative to insulin sensitivity.
This does not mean ISSI-2 should become another number consumers routinely order or attempt to optimize. It requires a properly performed OGTT with multiple insulin measurements, calculations are less standardized in routine practice than glucose or HbA1c, and it is not currently part of standard diagnostic criteria for prediabetes or diabetes. Its value in this discussion is primarily physiological: it allows researchers to distinguish insulin resistance from the pancreas's ability to compensate for that resistance.
That distinction is what made the new prospective study particularly useful. Instead of asking only whether greater insulin resistance predicted diabetes, the researchers asked whether the adequacy of beta-cell compensation could help distinguish people whose prediabetes progressed from those whose glucose regulation improved.
What the New Study Found
The 2026 study followed adults with prediabetes to determine whether beta-cell compensation or insulin resistance better distinguished different glycemic trajectories. Researchers analyzed 645 Chinese adults with prediabetes who had complete glucose and insulin measurements from an OGTT at baseline. Of these, 410 had glycemic outcomes available two years later. Rather than looking only at whether glucose increased, the investigators examined movement in both directions: 136 participants progressed to diabetes, while 61 reverted to normoglycemia.
ISSI-2 showed a clear relationship with glucose regulation even at baseline. Higher ISSI-2—indicating better beta-cell function relative to insulin sensitivity—was associated with lower fasting glucose, HbA1c, 1-hour glucose, and 2-hour glucose during the OGTT. Interestingly, the strongest association occurred with 1-hour glucose, an increasingly studied marker of early dysglycemia. More importantly, ISSI-2 was associated with what happened over the following two years: for every one-standard-deviation increase in ISSI-2, the odds of progressing to diabetes were about 50% lower (OR 0.505; 95% CI 0.382–0.668), while the odds of returning to normoglycemia were approximately 45% higher (OR 1.447; 95% CI 1.106–1.893).
The researchers also compared ISSI-2 with HOMA-IR, a commonly used fasting surrogate of insulin resistance. HOMA-IR showed less consistent associations with glycemic transitions than ISSI-2. The most informative picture emerged when the two measurements were considered together. Participants characterized by both higher insulin resistance and lower ISSI-2—in other words, substantial resistance combined with poorer beta-cell compensation—had approximately 2.8 times the odds of progressing to diabetes compared with participants who had lower insulin resistance and better beta-cell compensation (OR 2.764; 95% CI 1.459–5.237).
That result illustrates why these two physiological defects should not be treated as interchangeable. Insulin resistance increases the demand placed on the pancreas, while beta-cell function determines how effectively the pancreas can respond to that demand. High insulin resistance with preserved compensation is physiologically different from high insulin resistance accompanied by declining compensation. The glucose values may initially overlap, but the underlying metabolic reserve is different.
There are important limitations. This was an observational study, not an intervention trial, and only 410 of the original 645 participants had two-year outcome data. The population consisted of Chinese adults participating in a lifestyle-intervention cohort, so the results need replication in other populations. ISSI-2 also remains a surrogate measure rather than a direct measurement of beta-cell function. The authors therefore appropriately concluded that OGTT-derived assessment of beta-cell function may complement conventional glucose classification for short-term risk stratification, pending independent validation.
The clinical lesson is consequently broader than ISSI-2 itself: prediabetes becomes more informative when we ask not only how high glucose has risen, but how much insulin resistance is present and how successfully the beta cells are still compensating for it.
Same HbA1c, Different Metabolic Phenotypes
The practical importance of this research becomes clearer when we return to the two hypothetical patients with an HbA1c of 6.0%. HbA1c tells us that both have experienced similar average glycemic exposure, but it does not tell us how much insulin was required to produce that result. One person could be substantially insulin resistant and maintaining an HbA1c of 6.0% only because the pancreas is producing large amounts of insulin. Another could have less severe insulin resistance but an insulin response that is already inadequate for the glucose challenge. A third could have relatively normal fasting glucose but significant post-meal or OGTT abnormalities that are largely invisible when only fasting measurements are considered.
These patterns can represent different points along the progression toward type 2 diabetes. During earlier insulin resistance, compensatory hyperinsulinemia can maintain relatively normal glucose despite worsening insulin sensitivity. As beta-cell compensation becomes inadequate relative to insulin resistance, postprandial glucose may begin rising more prominently. With further deterioration, suppression of hepatic glucose production becomes increasingly inadequate and fasting glucose can rise as well. This progression is not identical in every person—hepatic and peripheral insulin resistance, beta-cell dysfunction, genetics, body-fat distribution, physical activity, diet, and other factors all influence the phenotype—but it illustrates why glucose alone cannot completely characterize metabolic status.
Consider what a fasting glucose of 108 mg/dL might mean in two different people. If one person requires a fasting insulin of 25 μIU/mL to maintain that glucose while another has an insulin of 6 μIU/mL, the physiology is clearly not identical. But even that comparison requires caution: the lower insulin value is not automatically better. In the second person, it could reflect greater insulin sensitivity—or it could represent insufficient insulin secretion for the degree of hyperglycemia present. Without additional context, a single fasting insulin measurement cannot reliably distinguish those possibilities.
This is also why metabolic testing becomes more informative when measurements are interpreted together rather than individually. Fasting glucose, HbA1c, fasting insulin, C-peptide, and an OGTT each answer somewhat different questions. Fasting insulin can provide evidence of compensatory hyperinsulinemia, while C-peptide can help assess endogenous insulin secretion because it is released alongside insulin from pancreatic beta cells. An OGTT adds a dynamic challenge, revealing how glucose and, when measured, insulin change after a standardized glucose load rather than examining only the fasting state.
None of these measurements provides a perfect standalone assessment of insulin resistance or beta-cell function. More sophisticated indices such as ISSI-2 are useful precisely because they integrate several aspects of the response. The larger clinical lesson, however, does not require every patient to undergo advanced physiological testing: two people can meet exactly the same criteria for prediabetes while having meaningfully different combinations of insulin resistance and beta-cell compensation. The diagnostic label tells us that glucose regulation is abnormal; understanding the phenotype can tell us considerably more about why.
What Fasting Insulin and C-Peptide Can Add
If glucose and HbA1c show the glycemic result, fasting insulin can provide additional information about how much insulin the body is using to maintain that result. A person with normal or mildly elevated fasting glucose but a disproportionately high fasting insulin may be compensating for reduced insulin sensitivity by producing more insulin. This compensatory hyperinsulinemia can appear before glucose crosses the diagnostic threshold for diabetes, which is why fasting insulin can sometimes reveal metabolic dysfunction that is less obvious from glucose alone.
Fasting insulin can also be combined with fasting glucose to calculate HOMA-IR, a surrogate estimate of insulin resistance. HOMA-IR is useful in research and can provide physiological context, but it has important limitations for individual interpretation. Insulin assays are not perfectly standardized between laboratories, there is no universally accepted HOMA-IR cutoff that applies to every population, and a fasting measurement primarily reflects the basal state rather than what happens after a meal. It should therefore be interpreted as one piece of the metabolic picture rather than a definitive diagnosis of insulin resistance.
C-peptide provides a different type of information. When pancreatic beta cells split proinsulin, insulin and C-peptide are released into the circulation in approximately equimolar amounts. Unlike insulin, C-peptide undergoes little first-pass extraction by the liver and remains in circulation longer, making it useful for estimating endogenous insulin secretion. It is particularly valuable when clinicians need to determine whether the pancreas is still producing insulin, including in people receiving injected insulin. However, C-peptide is influenced by factors such as glucose concentration and kidney function, so the number still requires clinical context.
Most importantly, neither a high insulin nor a high C-peptide automatically means that beta-cell function is healthy. If substantial insulin resistance is present, the pancreas should be producing more insulin. Likewise, a lower insulin or C-peptide value is not automatically evidence of excellent insulin sensitivity; if glucose is elevated, it could indicate that insulin secretion is becoming inadequate. This is the same principle captured more formally by disposition-index approaches such as ISSI-2: insulin secretion has to be considered relative to the metabolic demand placed on the beta cells.
For routine metabolic assessment, the goal is therefore not to collect as many biomarkers as possible, but to interpret complementary measurements together. Fasting glucose and HbA1c describe glycemia; fasting insulin can provide evidence of compensatory hyperinsulinemia; C-peptide provides information about endogenous insulin production; and an OGTT can reveal abnormalities that become apparent only when the system is challenged. Together, they can provide a more detailed physiological picture than a glucose value alone.
Why the OGTT Can Reveal What Fasting Tests Miss
Fasting glucose and HbA1c are convenient and clinically useful, but they examine glucose regulation from relatively limited perspectives. Fasting glucose primarily reflects the fasting state, when hepatic glucose production and its suppression by insulin are especially important, while HbA1c summarizes glycemic exposure over the preceding months. Neither shows directly how the body responds when a substantial glucose load suddenly enters the circulation. The oral glucose tolerance test (OGTT) provides that challenge by measuring the response after ingestion of a standardized 75-g glucose solution.
This dynamic response can reveal abnormalities that are not obvious in the fasting state. After glucose ingestion, pancreatic beta cells should rapidly increase insulin secretion while insulin-sensitive tissues—particularly skeletal muscle—increase glucose disposal and the liver suppresses endogenous glucose production. A person can therefore have a relatively unremarkable fasting glucose while showing an exaggerated or prolonged glucose excursion after the challenge. Conversely, examining insulin alongside glucose can reveal that apparently acceptable glucose is being maintained only through a substantial compensatory insulin response.
Timing also matters. The conventional OGTT focuses heavily on the 2-hour glucose value, but earlier measurements can provide additional physiological information. In recent years, 1-hour glucose has received increasing attention as a marker capable of identifying dysglycemia earlier than the traditional 2-hour threshold in some individuals. An international consensus panel has proposed a 1-hour glucose of ≥155 mg/dL (8.6 mmol/L) during a 75-g OGTT as a marker of intermediate hyperglycemia in people who would otherwise be considered normoglycemic, while a value ≥209 mg/dL (11.6 mmol/L) has been proposed as strongly suggestive of type 2 diabetes and requiring confirmation. These thresholds represent an evolving approach and have not replaced the established diagnostic criteria used by organizations such as the ADA.
Adding insulin measurements can make the OGTT even more physiologically informative because it allows glucose and insulin to be viewed as a response curve rather than isolated numbers. An early, appropriately scaled insulin response followed by efficient glucose clearance represents a different phenotype from delayed insulin secretion, prolonged hyperinsulinemia, or rising glucose despite substantial insulin concentrations. Research indices such as the Matsuda insulin sensitivity index and ISSI-2 use this dynamic information to estimate insulin sensitivity and beta-cell compensation more comprehensively than fasting measurements alone.
That additional information comes with tradeoffs. An OGTT requires fasting, standardized glucose ingestion, multiple blood draws, and several hours of testing, while insulin measurements and derived indices are not standardized sufficiently to justify interpreting every curve against a single universal “optimal” pattern. For that reason, the OGTT should not be viewed as necessary for everyone with an elevated HbA1c. Its value is that, when clinically appropriate, it can expose metabolic differences that a fasting glucose or HbA1c alone may compress into the same diagnosis of prediabetes.
Can Beta-Cell Dysfunction Be Reversed?
Declining beta-cell function does not necessarily mean that pancreatic insulin secretion is permanently lost. Particularly early in the development of type 2 diabetes, some of the apparent loss of beta-cell function can reflect reversible metabolic stress rather than irreversible destruction of beta cells. Chronic hyperglycemia, elevated circulating fatty acids, ectopic fat accumulation, and excessive secretory demand can impair the ability of beta cells to respond appropriately to glucose. Reducing those pressures can allow insulin secretion to improve, although the degree of recovery varies substantially between individuals.
Human remission studies provide some of the clearest evidence. In the DiRECT trial, substantial weight loss produced remission of type 2 diabetes in a meaningful proportion of participants, with remission strongly related to the magnitude of weight loss. Mechanistic studies from the same research program found reductions in liver and pancreatic fat alongside improvements in beta-cell function among responders. Importantly, insulin secretion did not simply increase indiscriminately; the first-phase insulin response to glucose recovered, suggesting that beta cells that had become metabolically dysfunctional could regain important aspects of normal function when the underlying metabolic environment improved.
This fits with the broader concept sometimes called the personal fat threshold. The amount of adipose tissue an individual can store safely varies. Once storage capacity is exceeded, excess lipid may accumulate in organs such as the liver and pancreas, contributing to hepatic insulin resistance, increased VLDL-triglyceride export, and impaired beta-cell function. Significant energy restriction and weight loss can reverse some of these abnormalities, particularly when intervention occurs relatively early. This does not mean pancreatic fat is the sole cause of type 2 diabetes, but ectopic fat provides one plausible mechanism connecting chronic energy surplus with both insulin resistance and impaired insulin secretion.
The same principle helps explain why prediabetes represents an important intervention window. Improving insulin sensitivity reduces the amount of insulin required to control glucose, effectively reducing the workload placed on beta cells. Weight loss when excess adiposity is present, regular physical activity, preservation or development of skeletal muscle, improved sleep, and dietary strategies that reduce excessive energy intake and postprandial glycemic demand can all contribute to improved metabolic control. Different dietary approaches can accomplish these goals, and current evidence does not establish one diet as universally necessary for preserving beta-cell function.
There are also limits to recovery. Longer diabetes duration, greater loss of functional beta-cell capacity, genetic susceptibility, and other metabolic factors can reduce the likelihood of achieving remission. Remission is therefore not synonymous with cure, and glucose can deteriorate again if the underlying metabolic pressures return. The important point is that progression from prediabetes to type 2 diabetes is not always an inevitable one-way process. The same heterogeneity seen in progression also exists in recovery—which helps explain why some participants in the new study progressed to diabetes while others returned to normoglycemia.
How Lab Testing Can Build a More Complete Metabolic Picture
The goal of metabolic testing should not be to collect the largest possible panel, but to answer specific physiological questions. Is glucose already abnormal? Is the body requiring unusually high insulin concentrations to maintain that glucose? Is endogenous insulin production still substantial? Does a glucose challenge reveal abnormalities that are not apparent while fasting? No single laboratory marker answers all of these questions, which is why interpretation becomes more useful when complementary measurements are considered together.
Fasting glucose and HbA1c remain the foundation because they establish the degree of glycemic abnormality and are part of standard diagnostic criteria. Adding fasting insulin can provide context about compensatory insulin demand, particularly when glucose is still relatively well controlled. From fasting glucose and insulin, HOMA-IR can be calculated as a surrogate estimate of insulin resistance, although its limitations and lack of a universal individual cutoff should be recognized. C-peptide can provide additional information about endogenous pancreatic insulin production, particularly when insulin secretion itself is an important clinical question.
For selected patients, an OGTT can provide another layer by showing how glucose behaves under a standardized metabolic challenge. Measuring insulin during the test can reveal the magnitude and timing of the compensatory response, although insulin-curve interpretation and derived measures such as ISSI-2 remain more established in research than in routine clinical practice. The new study should therefore not be interpreted as evidence that everyone with prediabetes needs ISSI-2 calculated. Its more useful lesson is that beta-cell compensation and insulin resistance represent different dimensions of metabolic health, and glucose-only testing cannot completely distinguish them.
Other laboratory markers can help characterize the broader metabolic environment rather than beta-cell function itself. A lipid panel, triglycerides, HDL-C, ApoB, liver enzymes, and other cardiometabolic measurements may provide evidence of accompanying dyslipidemia, fatty liver risk, or broader metabolic dysfunction. Blood pressure, waist circumference, body composition, physical activity, sleep, medications, family history, and changes in weight are equally important context. Laboratory values should complement that information rather than replace it.
For patients in Miami who need metabolic testing, QuickLab Mobile provides at-home specimen collection for many commonly ordered glucose, insulin, C-peptide, lipid, and cardiometabolic markers. The value of that testing is not simply finding another abnormal number. It is assembling enough information to move beyond the label of “prediabetes” and toward a more useful question: what metabolic phenotype is producing the abnormal glucose in this particular person?
Conclusion
Prediabetes is useful as a warning that glucose regulation has become abnormal, but it should not be mistaken for a single metabolic state. Two people can have the same HbA1c, fasting glucose, or even 2-hour OGTT result while differing substantially in insulin sensitivity, compensatory insulin secretion, post-challenge glucose handling, and remaining beta-cell capacity. The glucose value tells us what is happening at the surface; understanding the physiology requires asking what the pancreas and insulin-sensitive tissues are doing underneath it.
The new prospective study adds to this picture by showing that beta-cell compensation, estimated using ISSI-2, was associated with whether people with prediabetes progressed toward diabetes or returned toward normoglycemia over two years. HOMA-IR alone was less consistently associated with those transitions, while the combination of greater insulin resistance and poorer beta-cell compensation identified a particularly unfavorable metabolic phenotype. These findings do not establish ISSI-2 as a routine clinical test, but they reinforce an important principle: insulin resistance and beta-cell dysfunction are related, yet they are not the same problem.
That distinction also changes how we should think about early metabolic disease. A high insulin concentration can represent compensation for insulin resistance rather than healthy beta-cell function, while a relatively low insulin concentration is not automatically reassuring when glucose is elevated. Fasting glucose, HbA1c, fasting insulin, C-peptide, and—when appropriate—an OGTT provide different pieces of the same metabolic puzzle. None should be interpreted in isolation.
Most importantly, prediabetes does not inevitably progress to type 2 diabetes. Improving insulin sensitivity and reducing metabolic demand can decrease the workload placed on beta cells, and early beta-cell dysfunction can sometimes improve when the underlying metabolic environment improves. That makes identifying metabolic dysfunction early particularly valuable—not because every person needs increasingly complicated testing, but because the earlier we understand why glucose is rising, the greater the opportunity to address the processes driving it.
For patients in Miami interested in evaluating their metabolic health, QuickLab Mobile offers convenient at-home collection for many commonly ordered glucose, insulin, C-peptide, lipid, and cardiometabolic tests, allowing laboratory data to become part of a broader, individualized assessment rather than simply another diagnostic label.
👉 Need a specimen collection?. Book Now
Disclaimer:
The information provided in this blog, podcast, and associated content is for educational and informational purposes only and is not intended as a substitute for professional medical advice, diagnosis, or treatment. The content shared is based on reputable sources, medical literature, and expert insights, but it should not be used as a replacement for direct consultation with a licensed healthcare provider.
No Doctor-Patient Relationship: Engaging with this content does not create a doctor-patient relationship between you and QuickLabMobile or any contributors. Always consult with a qualified physician, specialist, or healthcare professional before making any medical decisions, changing your treatment plan, or starting/stopping any medications.
Not a Substitute for Medical Advice: While we strive to provide accurate and up-to-date information, medicine is constantly evolving. New research, treatments, and medical recommendations may emerge, and individual health conditions can vary. Do not rely solely on this content for health decisions. If you are experiencing symptoms, have concerns about your health, or require medical assistance, seek immediate care from a licensed medical professional.
Emergency Situations: If you are experiencing a medical emergency, such as difficulty breathing, chest pain, signs of a stroke, or any other life-threatening condition, call 911 (or your local emergency services) immediately. Do not delay seeking emergency care based on information provided here.
Liability Disclaimer: QuickLabMobile, its contributors, and any associated entities do not assume liability for any damages, harm, or adverse outcomes resulting from the use, interpretation, or misuse of the information provided in this content. You are responsible for your own healthcare decisions and should always verify information with a trusted medical professional.
External Links & References: This content may include links to external sources, medical studies, or third-party websites for further reading. These links are provided for convenience and informational purposes only. QuickLabMobile does not endorse, control, or take responsibility for the accuracy of external content. Always verify information with authoritative sources such as the CDC, NIH, WHO.
Final Note: Your health is unique, and what works for one person may not be suitable for another. Stay informed, ask questions, and always prioritize professional medical guidance