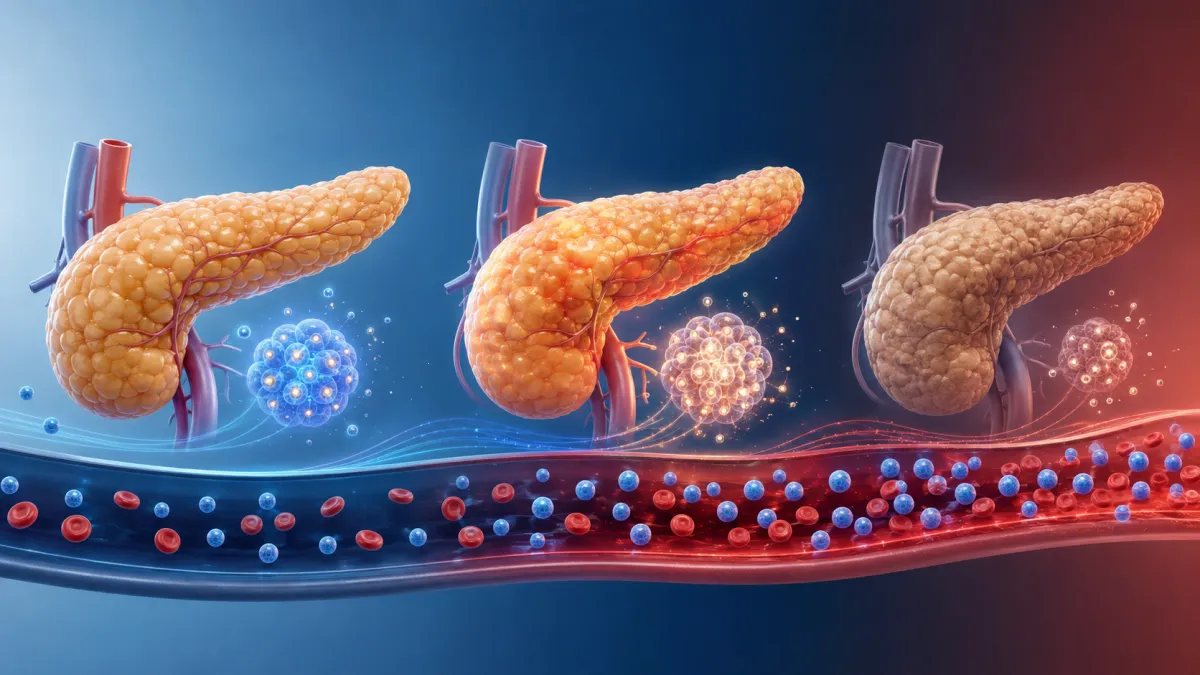
The Hidden Stages of Type 2 Diabetes
Introduction
Most people think type 2 diabetes begins when blood glucose or hemoglobin A1c crosses the diagnostic threshold. By that point, however, the metabolic process may have been developing silently for years. The body can initially keep glucose within the normal range by producing progressively more insulin, creating a stage in which conventional glucose testing may look reassuring while the underlying physiology is already changing.
Dr. Isabella Cooper and her colleagues describe this progression through a series of metabolic phenotypes rather than treating type 2 diabetes as a condition that suddenly appears. In their proposed framework, a metabolically healthy person may progress from normal glucose and normal insulin to a normoglycemic hyperinsulinemic stage—normal blood glucose maintained at the cost of excessive insulin secretion. This may be followed by hyperglycemia with continued hyperinsulinemia and, eventually, hyperglycemia accompanied by declining insulin production as pancreatic beta cells can no longer compensate.
This model changes how we interpret “normal” blood sugar. A fasting glucose of 90 mg/dL does not necessarily mean glucose regulation is effortless. One person may maintain that level with a relatively low insulin concentration, while another may require several times as much insulin to achieve the same result. The glucose measurement looks identical, but the metabolic states are very different.
Cooper’s metabolic phenotype framework challenges the glucose-centered view of diabetes by placing greater attention on basal insulin, beta-hydroxybutyrate, insulin resistance and the changing function of pancreatic beta cells. Although some mechanisms proposed in the paper remain debated, the central observation—that abnormal insulin regulation can precede hyperglycemia—is supported by longitudinal evidence. One study following normoglycemic adults for 24 years found that fasting hyperinsulinemia independently predicted later dysglycemia.
This helps explain why type 2 diabetes can seem to appear suddenly even though the underlying disease has not. Glucose may remain controlled during the compensatory phase because the pancreas is working harder. Only when that compensation becomes insufficient do fasting glucose, post-meal glucose and A1c begin to rise enough to meet conventional criteria for prediabetes or diabetes.
In this article, we will examine Cooper’s proposed stages of type 2 diabetes, beginning with the normoglycemic hyperinsulinemic phase and progressing toward pancreatic beta-cell dysfunction. We will also explore what fasting insulin, glucose, hemoglobin A1c, C-peptide, triglycerides, beta-hydroxybutyrate and glucose-tolerance testing may reveal at different stages—and why finding metabolic dysfunction before glucose rises could create a much earlier opportunity for intervention.
🎧 Listen to the Episode: The Hidden Stages of Insulin Resistance
Type 2 diabetes doesn't begin when glucose finally crosses a diagnostic threshold. Long before that happens, insulin may already be climbing to compensate for declining insulin sensitivity.
In this episode of The Health Pulse, we explore the hidden progression from normoglycemic hyperinsulinemia to prediabetes, type 2 diabetes, and eventual beta-cell dysfunction. We also explain how fasting insulin, HOMA-IR, insulin-response testing, ApoB, and C-peptide can provide information that glucose and HbA1c alone may miss.
▶️ Click play below to listen, or keep reading to discover why understanding the insulin required to maintain a “normal” glucose may reveal metabolic dysfunction years earlier.
Diabetes as a Metabolic Continuum
Dr. Isabella Cooper’s model presents type 2 diabetes as a progression of metabolic phenotypes rather than a diagnosis that begins only after blood glucose becomes elevated. The central argument is that glucose may remain normal for a long time because the pancreas compensates for declining insulin sensitivity by secreting more insulin.
In the framework proposed by Cooper and her colleagues, metabolically healthy individuals are separated from those entering the type 2 diabetes spectrum by looking beyond glucose alone. Fasting insulin, the insulin response to an oral glucose tolerance test, beta-hydroxybutyrate and hemoglobin A1c help describe how much hormonal effort is required to maintain glucose control.
The authors divide the type 2 diabetes spectrum into four stages.
Stage 1: Hyperinsulinemia with normoglycemia. Blood glucose remains within the normal range, but insulin is elevated. Cooper describes this as the long, silent phase of type 2 diabetes—sometimes called “pre-prediabetes”—because the pancreas is producing additional insulin to prevent glucose from rising.
Stage 2: Hyperinsulinemia with mildly elevated glucose. Insulin remains elevated, but compensation is becoming less effective. Fasting glucose and A1c begin moving into what is conventionally called prediabetes.
Stage 3: Hyperinsulinemia with hyperglycemia. Insulin is still elevated, yet it is no longer sufficient to overcome the degree of insulin resistance. Glucose now meets the conventional diagnostic criteria for type 2 diabetes.
Stage 4: Hyperglycemia with declining beta-cell capacity. After prolonged metabolic stress, pancreatic beta-cell function and sometimes beta-cell mass decline. Insulin production may fall relative to the body’s needs, creating what the authors describe as a “pseudo–type 1 diabetes” phenotype. This does not mean the person has autoimmune type 1 diabetes; it means endogenous insulin production has become insufficient after years of type 2 diabetes progression.
The paper also describes a fourth broad phenotype: type 2 diabetes remission. In this state, fasting and post-meal glucose and insulin responses improve, although the tendency toward metabolic dysfunction may return if the conditions that produced it are reintroduced.
This framework highlights an important rise-and-fall pattern. Insulin does not necessarily decline at the beginning of type 2 diabetes. It commonly rises first, remains elevated while glucose begins to increase and may decline only during more advanced beta-cell dysfunction. Measuring insulin at one isolated point without considering the disease stage can therefore produce a misleading interpretation.
Cooper’s stages are a proposed physiological framework, not the official diagnostic classification used by the American Diabetes Association. Prediabetes and diabetes are still diagnosed primarily with fasting glucose, A1c, oral glucose tolerance testing or random glucose in the appropriate clinical setting. The value of the model is that it asks an earlier question: how much insulin is required to keep those glucose values where they are?
Key takeaway: Type 2 diabetes may progress from normal glucose with elevated insulin to hyperglycemia with elevated insulin and eventually to hyperglycemia with declining insulin capacity. Glucose reveals when compensation is failing; insulin may reveal how hard the body was working before that failure became visible.
Stage 1: Normal Glucose, High Insulin
The normoglycemic hyperinsulinemic phase occurs when blood glucose remains normal only because the pancreas is producing more insulin than would ordinarily be required. The glucose result may look healthy, but the hormonal effort needed to maintain it has increased.
After a carbohydrate-containing meal, glucose enters the bloodstream and stimulates pancreatic beta cells to release insulin. Insulin helps skeletal muscle and adipose tissue take up glucose, suppresses glucose production by the liver and reduces the release of fatty acids from adipose tissue. In a metabolically healthy person, these effects occur with a relatively modest insulin response.
As insulin sensitivity declines, the same amount of insulin produces a weaker effect. The pancreas compensates by increasing basal insulin secretion and releasing more insulin after meals. This compensation may keep fasting glucose, post-meal glucose and A1c within their conventional reference ranges for years.
Consider two people who both have a fasting glucose of 90 mg/dL. One may have a fasting insulin of 4 µIU/mL, while the other has a fasting insulin of 18 µIU/mL. Their glucose results are identical, but the second person requires substantially more insulin to maintain that glucose concentration. Cooper’s framework would interpret these as different metabolic states.
This is why normal glucose does not always establish normal insulin sensitivity. In a 24-year follow-up study of adults who initially had normal glucose, higher basal insulin independently predicted the later development of dysglycemia. The glucose abnormality appeared later, but the elevated insulin had already identified increased metabolic risk.
Hyperinsulinemia may be most noticeable after meals before fasting insulin becomes clearly elevated. A person can have normal fasting glucose, a normal two-hour glucose result and even a normal A1c while producing an unusually large or prolonged insulin response during an oral glucose tolerance test. This pattern was described extensively by pathologist Joseph Kraft and contributes to the concept of “diabetes in situ”—abnormal insulin physiology hidden behind apparently acceptable glucose.
The relationship between insulin resistance and hyperinsulinemia is not entirely one-directional. Insulin resistance can cause the pancreas to release more insulin, but chronic hyperinsulinemia may also contribute to further insulin resistance through changes in receptor signaling, fat storage and fuel selection. Genetics, visceral adiposity, fatty liver, physical inactivity, poor sleep, chronic stress, medications and loss of skeletal muscle can all influence this process.
Elevated insulin also suppresses lipolysis and hepatic ketone production. A person in the normoglycemic hyperinsulinemic phase may therefore have low beta-hydroxybutyrate concentrations even after several hours without food. Cooper’s model gives this suppression of ketosis greater importance than conventional diabetes frameworks, although beta-hydroxybutyrate is not currently an established screening test for early type 2 diabetes.
There is no universally accepted fasting-insulin threshold that independently diagnoses hyperinsulinemia. Insulin assays vary between laboratories, and fasting insulin can be affected by the length of the fast, recent carbohydrate intake, stress, sleep, exercise, medications and insulin clearance by the liver. An isolated result should therefore be interpreted in context rather than treated as proof of disease.
The essential feature of Stage 1 is not hyperglycemia. It is the loss of metabolic efficiency: progressively more insulin is needed to produce a glucose result that still appears normal.
Key takeaway: During the normoglycemic hyperinsulinemic phase, normal glucose is maintained through increased insulin secretion. Standard glucose and A1c testing may therefore remain normal even though insulin resistance and metabolic dysfunction are already developing.
Stage 2: Insulin Can No Longer Hide the Problem
In Stage 2 of Cooper’s framework, insulin remains elevated, but it can no longer keep glucose completely within the normal range. Fasting glucose, post-meal glucose or A1c begins to rise, producing the metabolic pattern conventionally identified as prediabetes.
This transition does not necessarily mean the pancreas has stopped producing enough insulin. In many people, it is producing more insulin than normal. The problem is that the liver, skeletal muscle and adipose tissue are becoming progressively less responsive to its signals.
Skeletal muscle is responsible for much of the glucose disposal that occurs after a meal. When muscle becomes insulin resistant—because of physical inactivity, reduced muscle mass, ectopic fat, mitochondrial dysfunction or other factors—more glucose remains in circulation. The pancreas responds with a larger insulin release, but post-meal glucose may begin taking longer to return to baseline.
The liver contributes in a different way. Insulin normally suppresses hepatic glucose production after eating and during the overnight fast. With hepatic insulin resistance, the liver may continue releasing glucose even though both glucose and insulin are already elevated. This can gradually raise fasting glucose.
Adipose tissue is also an active participant. When fat cells become resistant to insulin’s suppression of lipolysis, more free fatty acids enter the circulation. These fatty acids can accumulate in the liver and skeletal muscle, worsening insulin signaling and contributing to fatty liver, elevated triglycerides and increased production of glucose by the liver.
At this stage, a person may show several different patterns. Fasting glucose may remain normal while post-meal glucose becomes elevated, or fasting glucose may rise before A1c crosses the prediabetes threshold. A1c can also appear acceptable while glucose varies substantially throughout the day because it represents an average rather than individual glucose excursions.
Under current American Diabetes Association criteria, prediabetes is identified by one or more of the following:
A1c from 5.7% to 6.4%
Fasting plasma glucose from 100 to 125 mg/dL
Two-hour glucose from 140 to 199 mg/dL during a 75-gram oral glucose tolerance test
Cooper’s original figure uses slightly different glucose boundaries, so her stages should not replace established diagnostic criteria. The important conceptual point is that Stage 2 represents a loss of complete compensation: insulin is still high, but glucose is beginning to escape its control.
Prediabetes is therefore not simply a mild glucose abnormality. It may reflect years of compensatory hyperinsulinemia accompanied by worsening insulin resistance, fatty liver, elevated triglycerides, increased blood pressure or visceral fat accumulation. Cardiovascular and metabolic risk can already be increasing even though the person does not yet meet the diagnostic threshold for diabetes.
This stage may still offer a substantial opportunity for improvement. Reducing the demand for insulin, improving muscle glucose disposal, addressing excess liver and pancreatic fat and restoring insulin sensitivity can allow glucose to return to the normal range. However, normalizing glucose does not necessarily mean that insulin has normalized; both sides of the metabolic response deserve attention.
Key takeaway: Stage 2 begins when elevated insulin can no longer keep glucose completely normal. Prediabetes may therefore represent established metabolic dysfunction rather than the beginning of the disease process.
Stage 3: High Glucose Despite High Insulin
Stage 3 develops when the pancreas is still producing large amounts of insulin, but the insulin response is no longer sufficient to overcome the degree of resistance. Both glucose and insulin may now be elevated—a pattern Cooper describes as hyperglycemic hyperinsulinemia.
This is an important distinction because type 2 diabetes is sometimes explained as if high glucose automatically means the body lacks insulin. During this stage, the person may have considerably more circulating insulin than a metabolically healthy individual. The deficiency is relative: insulin production is high, but it is inadequate for the metabolic conditions in which it must operate.
Skeletal muscle becomes less effective at removing glucose after meals. Because muscle represents a large potential reservoir for glucose disposal, reduced muscle insulin sensitivity can produce prolonged post-meal elevations. Physical inactivity, sarcopenia and intramuscular fat may further reduce this capacity.
The liver may continue producing and releasing glucose despite already elevated glucose and insulin. At the same time, insulin can continue stimulating pathways involved in fat production. This selective or partial hepatic insulin resistance helps explain how a person can experience hyperglycemia, fatty liver and elevated triglycerides simultaneously. The liver resists some of insulin’s signals while remaining responsive to others.
Adipose-tissue dysfunction also becomes more pronounced. Enlarged and insulin-resistant fat cells release more fatty acids into circulation. When the capacity to safely store energy in subcutaneous adipose tissue is exceeded, fat can accumulate in the liver, skeletal muscle, pancreas and other organs. This ectopic fat can further interfere with insulin signaling and beta-cell function.
As glucose remains elevated, glucotoxicity begins to reinforce the problem. Chronic exposure to high glucose can increase oxidative stress, disrupt mitochondrial function and impair the beta cells’ ability to release insulin appropriately. Elevated fatty acids may add lipotoxic stress. Together, these processes can gradually convert compensatory hyperinsulinemia into declining beta-cell capacity.
The timing of insulin secretion may also become abnormal before the total amount falls. A healthy pancreas rapidly releases a first phase of insulin shortly after glucose rises. In type 2 diabetes, this early response may be reduced or delayed, allowing a larger glucose excursion. The pancreas may then produce an exaggerated and prolonged later response, creating high glucose and high insulin at the same time.
Under current diagnostic criteria, diabetes is indicated by an A1c of at least 6.5%, fasting plasma glucose of at least 126 mg/dL or a two-hour glucose of at least 200 mg/dL during a 75-gram oral glucose tolerance test. A random glucose of at least 200 mg/dL with classic symptoms can also establish the diagnosis. In the absence of unequivocal hyperglycemia, an abnormal result generally requires confirmation.
Stage 3 is not metabolically identical in every patient. One person may have severe insulin resistance with strong insulin production, while another may already have substantial beta-cell dysfunction. This variation helps explain why people with the same A1c can respond differently to dietary changes, exercise and glucose-lowering medications.
Measuring fasting insulin or C-peptide can provide additional context, but neither result should be interpreted alone. C-peptide is released alongside endogenous insulin and can help estimate how much insulin the pancreas is producing, particularly in someone using injected insulin. Kidney function, glucose concentration, medication use and the timing of the sample all affect its interpretation.
Key takeaway: In Stage 3, glucose rises even though insulin may remain elevated. The problem is not necessarily an absolute lack of insulin but a combination of severe insulin resistance, mistimed insulin secretion and emerging beta-cell dysfunction.
Stage 4: Declining Insulin Production
Stage 4 represents the later phase of Cooper’s model. Blood glucose remains elevated, but the pancreas is losing its ability to produce enough insulin to meet the body’s needs. The earlier pattern of compensation is giving way to progressive beta-cell dysfunction.
Insulin production does not usually fall to zero. Many people with advanced type 2 diabetes continue producing more insulin than someone with type 1 diabetes, but less than their degree of insulin resistance requires. This is why the condition is better described as a relative insulin deficiency rather than a complete absence of insulin.
Cooper uses the term “pseudo–type 1 diabetes” to describe this advanced phenotype. The term emphasizes severe insulin insufficiency following prolonged type 2 diabetes, but it is not a standard clinical diagnosis. Unlike autoimmune type 1 diabetes, the immune system has not necessarily destroyed the pancreatic beta cells, and measurable endogenous insulin production may remain.
Several processes may contribute to the decline. Chronic exposure to elevated glucose, fatty acids, oxidative stress, inflammation and excess demand can disrupt beta-cell function. Islet amyloid deposition may also interfere with normal pancreatic architecture and insulin secretion.
Some beta cells may undergo apoptosis, but loss of function is not always the same as permanent cell death. Research suggests that metabolically stressed beta cells can become dedifferentiated, meaning they lose some of the characteristics required for normal insulin production. Reducing glucose toxicity and metabolic stress may allow a portion of this function to recover, particularly during earlier or shorter-duration type 2 diabetes.
This helps explain why insulin production can improve after substantial weight loss, carbohydrate restriction, intensive glucose management or reduction of excess liver and pancreatic fat. Early type 2 diabetes has demonstrated a meaningful capacity for remission in selected patients. Recovery becomes less predictable as disease duration increases and functional beta-cell capacity continues to decline.
Symptoms may become more noticeable during this stage. Persistent hyperglycemia can cause increased thirst, frequent urination, blurred vision, fatigue, recurrent infections, slow wound healing and unintended weight loss. Very high glucose can also produce dehydration and a hyperosmolar hyperglycemic state, which requires urgent treatment.
C-peptide testing can help estimate remaining endogenous insulin production. Because C-peptide is released when the pancreas produces its own insulin, a low result in the presence of elevated glucose suggests limited beta-cell reserve. A normal or high result may indicate that substantial insulin production continues but is being overwhelmed by insulin resistance. Kidney function and the glucose concentration at the time of testing must be considered.
Some patients at this stage require injected insulin to control severe hyperglycemia and prevent acute complications. Insulin therapy should not be interpreted as proof that the person has type 1 diabetes or that metabolic interventions no longer matter. Improving insulin sensitivity and reducing glucose exposure may still lower medication requirements, although insulin must never be reduced or discontinued without appropriate monitoring and clinical supervision.
The distinction between insulin-resistant type 2 diabetes and autoimmune diabetes is especially important in lean adults, people who deteriorate rapidly or those with unexpectedly low C-peptide. Testing for GAD65, IA-2 and ZnT8 autoantibodies may be appropriate when latent autoimmune diabetes in adults or another form of diabetes is suspected.
Key takeaway: In Stage 4, pancreatic insulin production has declined relative to the body’s needs, but it is rarely absent. This advanced phase differs from autoimmune type 1 diabetes, and testing C-peptide and, when appropriate, pancreatic autoantibodies can clarify the underlying physiology.
Remission: When the Process Moves Backward
Type 2 diabetes does not always progress in one direction. Cooper’s framework includes a separate remission phenotype in which fasting and post-meal glucose return to normal, insulin concentrations improve and the person regains greater metabolic flexibility.
Remission is not the same as a cure. The metabolic conditions that produced diabetes can return, particularly if insulin resistance, ectopic fat, physical inactivity or excessive glucose demand redevelop. Continued monitoring remains important even when glucose and A1c have normalized.
An international expert consensus convened by the American Diabetes Association defines type 2 diabetes remission as an A1c below 6.5% for at least three months without glucose-lowering medication. When A1c is unreliable, fasting glucose or other validated measurements may be considered. This definition provides a practical clinical standard, but it does not require insulin levels to return to normal.
Cooper’s phenotype is more physiologically demanding. It considers not only whether glucose has normalized but also how much insulin is required to maintain it. A person could satisfy the clinical definition of remission while continuing to have compensatory hyperinsulinemia. Their glucose has improved enough to fall below the diabetes threshold, but the underlying insulin resistance may not have completely resolved.
For example, two people may both achieve an A1c of 5.8% without medication. One may have normal fasting and post-meal insulin responses, while the other still produces excessive insulin after eating. Both meet the glucose-based definition of remission, but they may not have the same risk of future relapse.
Substantial weight loss can produce remission by reducing fat stored in the liver and pancreas. As liver fat declines, hepatic insulin sensitivity can improve, allowing insulin to suppress glucose production more effectively. Reduced pancreatic fat and lower glucose exposure may also permit beta cells to recover part of their normal insulin response.
Carbohydrate restriction can create another pathway to normal glucose. By reducing the amount of dietary glucose requiring disposal, it lowers the immediate demand for insulin and can quickly improve glycemic control. Over time, reductions in liver fat, triglycerides and overall energy excess may further improve insulin sensitivity. However, someone following a low-carbohydrate diet may have normal glucose partly because the dietary glucose challenge has been reduced. That does not automatically demonstrate normal tolerance to a large carbohydrate load.
Exercise contributes through mechanisms that extend beyond weight loss. Contracting muscle can take up glucose through pathways that are partly independent of insulin. Resistance training can increase the amount of metabolically active muscle available for glucose disposal, while aerobic exercise improves mitochondrial function and insulin sensitivity.
The duration of diabetes matters. Remission is generally more achievable when beta-cell function is still relatively preserved and the disease has not been present for many years. That does not mean improvement is impossible in advanced diabetes, but complete medication-free remission becomes less predictable.
Monitoring after remission should include more than an occasional A1c. Fasting glucose, post-meal responses, triglycerides, HDL cholesterol, liver markers, waist circumference and blood pressure can help show whether metabolic health is being maintained. Fasting insulin or C-peptide may add context in selected patients, although neither has a universally accepted target for defining remission.
Medication must be adjusted carefully during rapid dietary change or weight loss. Insulin, sulfonylureas and some other glucose-lowering medications can cause hypoglycemia if glucose improves faster than treatment is modified. Remission should be documented with a healthcare professional rather than established by stopping medication independently.
Key takeaway: Clinical remission means maintaining an A1c below the diabetes threshold without glucose-lowering medication. Cooper’s model asks a deeper question: has glucose normalized because insulin sensitivity improved, or is the body still relying on excessive insulin to keep glucose controlled?
Why A1c Can Miss the Earliest Stage
A1c and fasting glucose are valuable tests, but they answer a limited question: has blood glucose become abnormal? They do not show how much insulin the pancreas must produce to keep glucose within that range.
During Stage 1, glucose may be normal precisely because insulin is elevated. The pancreatic beta cells are compensating successfully, so the abnormality remains hidden when testing focuses only on glucose. From a conventional diagnostic perspective, the person does not have prediabetes. From Cooper’s physiological perspective, the disease process may already be underway.
A1c estimates average glucose exposure over approximately two to three months. An average can conceal substantial variation. Someone may experience high post-meal peaks followed by long periods of normal or lower glucose, producing an A1c that still appears acceptable. A1c also provides no information about the insulin response that produced that average.
Fasting glucose is another snapshot. It is influenced primarily by overnight liver glucose production and the body’s ability to suppress it. A person may maintain a fasting glucose of 85 to 95 mg/dL while producing an elevated fasting insulin concentration. Alternatively, fasting glucose may remain normal while the earliest abnormalities appear after meals.
The oral glucose tolerance test can reveal impaired glucose handling that fasting glucose misses, but a glucose-only test still overlooks compensatory hyperinsulinemia. If glucose returns to an acceptable level after two hours, the result may be classified as normal even when the pancreas required an unusually large or prolonged insulin response to achieve it.
This distinction motivated pathologist Joseph Kraft to measure insulin repeatedly during oral glucose tolerance testing. His work identified people with apparently normal glucose tolerance who displayed delayed or excessive insulin patterns. Cooper’s framework incorporates this idea by emphasizing that insulin abnormalities can precede conventional dysglycemia.
Continuous glucose monitoring can provide a more detailed view of glucose excursions, overnight patterns and the time required to return to baseline after eating. It may reveal variability that A1c cannot show. However, a flat glucose curve does not prove normal insulin sensitivity. The curve may remain flat because the pancreas released enough insulin to prevent a visible rise.
A1c also has biological limitations unrelated to metabolism. Anemia, iron deficiency, kidney disease, recent blood loss, transfusion, pregnancy, hemoglobin variants and changes in red blood cell lifespan can make the result higher or lower than the person’s true average glucose exposure. Discordance between A1c, fasting glucose and home measurements should therefore be investigated rather than ignored.
None of these limitations makes glucose or A1c unhelpful. They remain standardized, accessible and strongly associated with diabetes complications. The problem arises when a normal glucose-based result is interpreted as proof that insulin regulation is normal.
Combining glucose with fasting insulin, C-peptide or a paired glucose-insulin response may provide a more complete metabolic picture in selected patients. These additional measurements require careful interpretation because insulin assays are not fully standardized and no universally accepted insulin threshold diagnoses Stage 1 type 2 diabetes.
Key takeaway: A1c and fasting glucose usually identify diabetes after glucose regulation has begun to fail. They may not detect the earlier compensatory phase in which glucose remains normal because the pancreas is producing excessive insulin.
Tests That Reveal the Metabolic Stage
No single laboratory result can place every person neatly into Cooper’s stages. The most useful assessment combines glucose measurements with markers of insulin production, insulin resistance, lipid metabolism and pancreatic beta-cell function.
Fasting glucose shows the concentration of glucose remaining in the circulation after an overnight fast. It is useful for detecting impaired hepatic glucose regulation, but it cannot determine how much insulin was required to achieve that result. A normal fasting glucose should therefore be interpreted differently when fasting insulin is low than when fasting insulin is markedly elevated.
Fasting insulin adds this missing context. An elevated result with normal glucose is consistent with compensatory hyperinsulinemia, while elevated glucose with elevated insulin suggests that compensation is becoming insufficient. Low or inappropriately normal insulin in the presence of significant hyperglycemia may indicate declining beta-cell reserve.
There is no universally accepted fasting-insulin cutoff for diagnosing hyperinsulinemia. Laboratories use different assays and reference ranges, and insulin concentrations are affected by recent diet, fasting duration, sleep, stress, exercise, liver clearance and medication. Trends measured under similar conditions may be more informative than one isolated value.
Fasting glucose and insulin can be combined to calculate the homeostatic model assessment of insulin resistance, commonly called HOMA-IR:
For example, a fasting glucose of 90 mg/dL and fasting insulin of 5 µIU/mL produces a HOMA-IR of approximately 1.1. The same glucose with an insulin of 20 µIU/mL produces a HOMA-IR of approximately 4.4. Glucose appears identical, but the calculated insulin resistance is very different.
HOMA-IR is an estimate rather than a diagnosis. Cutoffs vary by population, ethnicity, age and laboratory method. It primarily reflects fasting hepatic insulin resistance and may not detect abnormal post-meal insulin secretion.
A glucose tolerance test with paired insulin measurements can provide a more dynamic view. Glucose and insulin may be measured before consuming 75 grams of glucose and again at selected intervals afterward. This can reveal how high insulin rises, when it peaks and how long it remains elevated.
A healthy glucose value at two hours does not necessarily mean the insulin response was normal. An exaggerated early peak or persistently elevated insulin may indicate that the pancreas is compensating for reduced insulin sensitivity. However, insulin-measured oral glucose tolerance tests are not standardized for routine diabetes diagnosis, and the interpretation of Kraft-style patterns remains outside conventional diagnostic guidelines.
C-peptide helps estimate endogenous insulin production. The pancreas releases insulin and C-peptide in approximately equal amounts, but the liver removes a substantial portion of insulin before it reaches systemic circulation. C-peptide remains in the blood longer and can be particularly helpful when a person uses injected insulin.
C-peptide must be interpreted alongside glucose. A seemingly normal C-peptide may be inadequate when glucose is very high, while an elevated result may reflect strong insulin production, insulin resistance or reduced clearance from kidney dysfunction. A stimulated C-peptide test may provide more information than a fasting measurement when beta-cell reserve is uncertain.
A1c, fasting glucose and post-meal glucose remain necessary for identifying dysglycemia. A1c estimates longer-term glucose exposure, while fasting and post-meal testing can reveal patterns an average may conceal. Continuous glucose monitoring can add information about variability, meal responses and overnight glucose, although it cannot measure insulin.
Triglycerides, HDL cholesterol and liver markers provide indirect metabolic context. Elevated triglycerides, low HDL, fatty liver and increased waist circumference commonly accompany insulin resistance. The triglyceride-to-HDL ratio can be a useful warning sign, but it is not specific enough to diagnose hyperinsulinemia by itself.
Cooper’s model also considers beta-hydroxybutyrate. Elevated insulin suppresses hepatic ketone production, so persistently low BHB may accompany hyperinsulinemia. However, ketones are strongly influenced by recent carbohydrate intake, fasting duration, exercise and total energy intake. BHB is not an established diagnostic test for early type 2 diabetes.
The purpose of combining these measurements is not to create a diagnosis from every small deviation. It is to determine whether glucose control is metabolically efficient, maintained through excessive insulin secretion or beginning to fail because insulin resistance and beta-cell dysfunction are progressing.
Key takeaway: Glucose shows the outcome, while insulin and C-peptide help reveal the effort and pancreatic capacity behind it. Combining these markers can distinguish normal glucose regulation from glucose that remains normal only through compensatory hyperinsulinemia.
What Drives Progression Through the Stages?
Progression from normoglycemic hyperinsulinemia to overt type 2 diabetes is not caused by one food, one hormone or one behavior. It develops when glucose demand, fat storage, insulin sensitivity and pancreatic compensation become mismatched over time.
Adipose tissue plays a central role. Body fat is not simply passive energy storage; it is an endocrine organ that helps keep excess energy away from the liver, skeletal muscle and pancreas. When subcutaneous fat cells reach their individual storage capacity, become enlarged or dysfunctional, more fatty acids can spill into circulation and accumulate in organs that are not designed for long-term fat storage.
This helps explain the personal fat threshold. Some people can gain considerable weight without developing diabetes, while others develop fatty liver and insulin resistance at a relatively low body mass index. Genetics, ethnicity, fat distribution and the ability to create new subcutaneous fat cells influence how much energy can be safely stored before metabolic complications appear.
Fat accumulation in the liver contributes to hepatic insulin resistance. Insulin becomes less effective at suppressing glucose production, so the liver continues releasing glucose during fasting and after meals. At the same time, pathways that convert excess energy into triglycerides may remain active, contributing to fatty liver, elevated triglycerides and increased secretion of triglyceride-rich lipoproteins.
Skeletal muscle determines how much glucose can be cleared after eating. Low muscle mass, physical inactivity and intramuscular fat reduce the capacity for glucose disposal. This becomes particularly important with aging, chronic illness, prolonged inactivity or neuromuscular disease. The pancreas must produce more insulin to move the same glucose load into a smaller or less responsive muscle compartment.
Dietary pattern influences both glucose demand and energy storage. Frequent consumption of refined carbohydrates, sugar-sweetened beverages and ultra-processed foods can repeatedly increase glucose and insulin while making excess energy intake easier. Dietary fat can also contribute to ectopic fat accumulation when total energy intake chronically exceeds the body’s needs. The metabolic effect depends on the broader dietary pattern, insulin sensitivity, activity level and individual storage capacity.
Frequent eating may keep insulin elevated for longer portions of the day, particularly when meals and snacks contain substantial digestible carbohydrate. This can reduce the time available for lipolysis and ketone production. Cooper gives chronic suppression of ketosis a prominent role in the development of hyperinsulinemia, although the extent to which low ketones independently cause disease remains uncertain.
Sleep deprivation, obstructive sleep apnea and disrupted circadian rhythms can reduce insulin sensitivity. Cortisol and sympathetic nervous system activity increase, appetite regulation changes and the liver may release more glucose. Chronic psychological stress can produce similar effects, although the magnitude varies between individuals.
Hormonal and medical conditions can accelerate progression. Excess cortisol, excess growth hormone, polycystic ovary syndrome, lipodystrophy and some thyroid disorders can interfere with insulin action. Glucocorticoids, certain antipsychotic medications, some immunosuppressants and other drugs may also raise glucose or worsen insulin resistance.
Genetics affects both insulin sensitivity and the ability of beta cells to compensate. Some individuals can maintain high insulin output for decades, while others experience beta-cell dysfunction much earlier. Family history can therefore reflect susceptibility even when family members do not share identical diets or body weights.
Hyperinsulinemia may initially be a compensatory response to insulin resistance, but the relationship may become bidirectional. Prolonged exposure to elevated insulin may further alter insulin signaling, fat storage and fuel use. It is therefore difficult to assign one universal starting point: insulin resistance can drive hyperinsulinemia, and chronic hyperinsulinemia may help sustain the insulin-resistant state.
Progression occurs when compensation can no longer keep pace. As liver and muscle insulin resistance increase, the pancreas is required to release more insulin. As beta-cell function begins to deteriorate, glucose rises. The resulting glucotoxicity and ectopic fat can then accelerate the decline.
Key takeaway: Type 2 diabetes progresses through interactions among adipose-tissue capacity, fatty liver, muscle insulin resistance, diet, physical activity, sleep, hormones, medications and genetic susceptibility. Hyperglycemia appears when pancreatic compensation can no longer overcome this combined metabolic burden.
Intervening Before Glucose Rises Further
The normoglycemic hyperinsulinemic stage may represent the largest opportunity for prevention because pancreatic compensation is still working. The objective is not merely to force glucose lower; it is to reduce the amount of insulin required to maintain glucose control.
For people carrying excess liver, pancreatic or visceral fat, reducing the underlying energy surplus can substantially improve insulin sensitivity. Even modest weight loss can lower liver fat and decrease the amount of insulin needed to suppress hepatic glucose production. The appropriate goal should account for body composition because a lean person with insulin resistance may not benefit from indiscriminate weight loss.
Evidence from the Diabetes Prevention Program demonstrated that an intensive lifestyle intervention reduced progression to type 2 diabetes by 58% over approximately three years in high-risk adults. The program combined modest weight loss with dietary change and at least 150 minutes of physical activity per week. It did not measure Cooper’s Stage 1 specifically, but it established that metabolic progression can be altered before overt diabetes develops.
Carbohydrate reduction directly lowers the amount of dietary glucose requiring insulin-mediated disposal. Eliminating sugar-sweetened beverages, refined grains and frequently consumed high-carbohydrate snacks can reduce post-meal glucose and insulin exposure without requiring a ketogenic diet.
A more structured low-carbohydrate or ketogenic approach may produce a larger reduction in insulin demand for some people. Lower insulin allows greater release of stored fatty acids and hepatic production of beta-hydroxybutyrate. Cooper emphasizes this restoration of nutritional ketosis as a sign that insulin is no longer chronically suppressing fat-based metabolism.
Ketosis itself should not be mistaken for proof that insulin resistance has resolved. Ketone levels are influenced by carbohydrate intake, fasting, calorie consumption and exercise. A person can generate ketones through dietary restriction while still having underlying metabolic susceptibility. Long-term evidence is stronger for improving glucose regulation and reducing diabetes risk than for using a specific ketone concentration as a treatment target.
Mediterranean, lower-carbohydrate and other minimally processed dietary patterns can all improve metabolic health when they reduce excess energy intake and can be maintained. The most appropriate plan depends on glucose responses, medication use, food preferences, nutritional status and whether the person needs to lose, maintain or gain weight.
Resistance training is particularly valuable because skeletal muscle is a major site of glucose disposal. Increasing or preserving muscle provides a larger metabolic reservoir for glucose after meals. Aerobic activity improves insulin sensitivity and mitochondrial capacity, while walking after eating can reduce the duration of post-meal glucose elevations.
Long periods of sitting should also be interrupted. A person can complete a daily workout and still spend most of the remaining day inactive. Brief movement throughout the day activates muscle glucose uptake and may lower the insulin required to manage meals.
Sleep and circadian consistency deserve the same attention as nutrition. Inadequate sleep and untreated obstructive sleep apnea can increase cortisol, sympathetic activity, appetite and insulin resistance. Improving food quality while ignoring severe sleep disruption may leave a major metabolic driver untreated.
Time-restricted eating or reducing unnecessary snacking can create longer periods of lower insulin between meals. Some people may benefit from eating fewer times per day, provided they can meet their nutritional needs without hypoglycemia, binge eating or excessive restriction. Prolonged fasting is not required for diabetes prevention and may be inappropriate during pregnancy, eating disorders, frailty or certain medical treatments.
Metformin may be considered for selected adults at high risk of type 2 diabetes. In the Diabetes Prevention Program, metformin reduced progression by 31% compared with placebo and was particularly effective in younger adults with obesity and women with previous gestational diabetes. Medication decisions should be individualized rather than based on fasting insulin alone.
People taking insulin, sulfonylureas or other medications capable of causing hypoglycemia require clinical supervision when substantially reducing carbohydrates, fasting or losing weight. Medication requirements can change faster than A1c reflects.
Progress should be judged through trends in glucose, insulin demand, waist circumference, triglycerides, liver health, strength and overall clinical status. A lower fasting insulin is encouraging only when it occurs alongside stable or improved glucose. Falling insulin with worsening hyperglycemia may instead indicate declining beta-cell capacity.
Key takeaway: Early intervention should reduce insulin demand while improving liver, muscle and adipose-tissue insulin sensitivity. Nutrition, physical activity, muscle preservation, sleep and appropriate medical treatment can slow or reverse metabolic progression before glucose reaches the diabetes range.
How Lab Testing Helps
The greatest clinical value of Cooper’s model is the possibility of identifying metabolic dysfunction before fasting glucose or A1c reaches the prediabetes range. Doing this requires looking at glucose and insulin together rather than treating either result in isolation.
A useful initial assessment may include fasting glucose, fasting insulin and A1c. Fasting glucose shows the immediate glycemic state, A1c estimates longer-term exposure and fasting insulin provides context about how much pancreatic effort may be required to maintain those values.
These results can help distinguish several patterns. Normal glucose with relatively low insulin is consistent with efficient regulation. Normal glucose with elevated insulin may suggest the compensatory stage. Elevated glucose with high insulin supports substantial insulin resistance, while elevated glucose with low or inappropriately normal insulin raises concern about declining beta-cell capacity.
C-peptide can provide additional information about endogenous insulin production. It is particularly useful for people already using injected insulin, those with longstanding diabetes or patients whose clinical presentation does not fit typical insulin-resistant type 2 diabetes. Low C-peptide with significant hyperglycemia may warrant evaluation for advanced beta-cell failure, autoimmune diabetes or another form of diabetes.
A lipid panel adds information about the metabolic consequences of insulin resistance. Elevated triglycerides and low HDL cholesterol commonly accompany increased liver fat and the overproduction of triglyceride-rich lipoproteins. ApoB can estimate the total number of atherogenic particles and help assess the cardiovascular risk that often develops alongside hyperinsulinemia.
A comprehensive metabolic panel provides glucose together with liver and kidney markers. ALT, AST and GGT may offer clues about metabolic liver stress, although normal liver enzymes do not exclude fatty liver. Creatinine and estimated glomerular filtration rate are important when interpreting medication choices and C-peptide results.
Additional testing should be guided by the individual’s history. Thyroid abnormalities, excess cortisol, polycystic ovary syndrome, sleep apnea, medications and other endocrine conditions can influence insulin sensitivity. Testing should investigate plausible contributors rather than creating an unnecessarily broad panel for everyone.
An oral glucose tolerance test with paired insulin measurements may be considered when fasting results appear normal despite strong clinical evidence of insulin resistance. Measuring glucose alone determines whether glucose tolerance is impaired. Measuring insulin at the same intervals can show whether an excessive or delayed insulin response is masking that impairment. This approach requires a clinician familiar with dynamic insulin patterns because interpretation is not standardized.
Consistency is important when comparing fasting insulin. Samples should be collected after the recommended fasting period and, when possible, under similar conditions. Acute illness, severe sleep deprivation, unusual exercise, alcohol exposure and recent major dietary changes can temporarily affect the result.
One abnormal fasting-insulin measurement does not establish Stage 1 type 2 diabetes. The result should be considered alongside glucose, A1c, triglycerides, waist circumference, blood pressure, family history and changes over time. Repeated trends are usually more meaningful than a single number.
QuickLab Mobile offers at-home blood collection in Miami for fasting glucose, insulin, A1c, C-peptide, comprehensive metabolic panels, lipid testing, ApoB and other cardiometabolic markers ordered as part of an individualized assessment. At-home collection can make fasting and repeat testing more practical by eliminating the need to travel to a laboratory before the blood draw.
The purpose of earlier testing is not to label every person with normal glucose as diabetic. It is to identify when normal glucose is being maintained efficiently and when it may be maintained through excessive insulin secretion—while there is still time to address the underlying metabolic drivers.
Key takeaway: Glucose reveals the level being controlled, while insulin and C-peptide help reveal the effort and pancreatic capacity behind that control. Testing them together can provide a more complete picture of where a person may be along the type 2 diabetes continuum.
Conclusion
Type 2 diabetes does not suddenly begin when fasting glucose reaches 126 mg/dL or A1c reaches 6.5%. Those thresholds identify the point at which glucose regulation has deteriorated enough to meet a clinical definition. The metabolic process may have been developing for many years before that moment.
Dr. Isabella Cooper’s framework describes this progression as a series of changing phenotypes. It begins with normoglycemic hyperinsulinemia, when the pancreas produces additional insulin to keep glucose normal. As compensation becomes less effective, glucose enters the prediabetes range while insulin remains elevated. Overt diabetes follows when high insulin can no longer overcome insulin resistance, and later disease may include declining beta-cell capacity and relative insulin deficiency.
This rise-and-fall pattern of insulin is essential to understanding type 2 diabetes. Insulin may be elevated during the earliest and middle stages, then decline as pancreatic function deteriorates. Two people with the same glucose or A1c can therefore have very different insulin production, insulin sensitivity and potential for recovery.
Cooper’s stages are not an official diagnostic classification, and fasting insulin does not have a universally accepted threshold for diagnosing early diabetes. The model’s strength is conceptual: it reminds us that normal glucose does not always mean normal metabolic function and that glucose should be interpreted alongside the insulin response maintaining it.
Earlier recognition creates an opportunity to act while pancreatic compensation is still strong. Improving muscle activity, reducing excess liver and pancreatic fat, lowering unnecessary glucose demand, addressing sleep and hormonal contributors and using medication when appropriate can reduce the metabolic pressure driving progression.
QuickLab Mobile provides convenient at-home blood collection in Miami for fasting glucose, fasting insulin, A1c, C-peptide, lipid testing, ApoB and other cardiometabolic markers. These results can help a qualified healthcare professional evaluate not only whether glucose is elevated, but also how the body is producing and using insulin.
👉 Need a specimen collection?. Book Now
Disclaimer:
The information provided in this blog, podcast, and associated content is for educational and informational purposes only and is not intended as a substitute for professional medical advice, diagnosis, or treatment. The content shared is based on reputable sources, medical literature, and expert insights, but it should not be used as a replacement for direct consultation with a licensed healthcare provider.
No Doctor-Patient Relationship: Engaging with this content does not create a doctor-patient relationship between you and QuickLabMobile or any contributors. Always consult with a qualified physician, specialist, or healthcare professional before making any medical decisions, changing your treatment plan, or starting/stopping any medications.
Not a Substitute for Medical Advice: While we strive to provide accurate and up-to-date information, medicine is constantly evolving. New research, treatments, and medical recommendations may emerge, and individual health conditions can vary. Do not rely solely on this content for health decisions. If you are experiencing symptoms, have concerns about your health, or require medical assistance, seek immediate care from a licensed medical professional.
Emergency Situations: If you are experiencing a medical emergency, such as difficulty breathing, chest pain, signs of a stroke, or any other life-threatening condition, call 911 (or your local emergency services) immediately. Do not delay seeking emergency care based on information provided here.
Liability Disclaimer: QuickLabMobile, its contributors, and any associated entities do not assume liability for any damages, harm, or adverse outcomes resulting from the use, interpretation, or misuse of the information provided in this content. You are responsible for your own healthcare decisions and should always verify information with a trusted medical professional.
External Links & References: This content may include links to external sources, medical studies, or third-party websites for further reading. These links are provided for convenience and informational purposes only. QuickLabMobile does not endorse, control, or take responsibility for the accuracy of external content. Always verify information with authoritative sources such as the CDC, NIH, WHO.
Final Note: Your health is unique, and what works for one person may not be suitable for another. Stay informed, ask questions, and always prioritize professional medical guidance